For decades, state education agencies (SEAs) have relied on a limited set of metrics primarily with graduation rates and standardized test scores to gauge student and school success. While these data points are important, they offer only a narrow, rearview-mirror perspective. The modern mandate of education, however, is to prepare every learner for college, career, and civic life. To meet this comprehensive goal, SEAs require a tool that is as dynamic, holistic, and forward-looking as the students they serve.
This is the imperative behind the Graduates Proceed to Succeed (GPS) Dashboard: to move beyond basic compliance reporting and provide a true, statewide compass for student and system improvement.
The Pitfalls of a Limited View
The traditional focus on siloed, end-of-year data creates significant challenges for educational leaders:
Delayed Intervention: Data that stops at graduation is too late to inform timely, mid-course corrections. Leaders struggle to pinpoint readiness gaps in an 8th grader’s foundational math skills or a 10th grader’s mental well-being—critical stages where early support makes the biggest difference.
Misaligned Resources: Without a clear, longitudinal view of where students and regions are struggling across multiple dimensions of readiness, state and district leaders cannot align funding and resources to the areas of highest need.
Opaque Communication: Public trust is built on transparency. Simply reporting test scores does not effectively communicate to families and policymakers whether graduates are genuinely prepared for the modern workforce or civic participation.
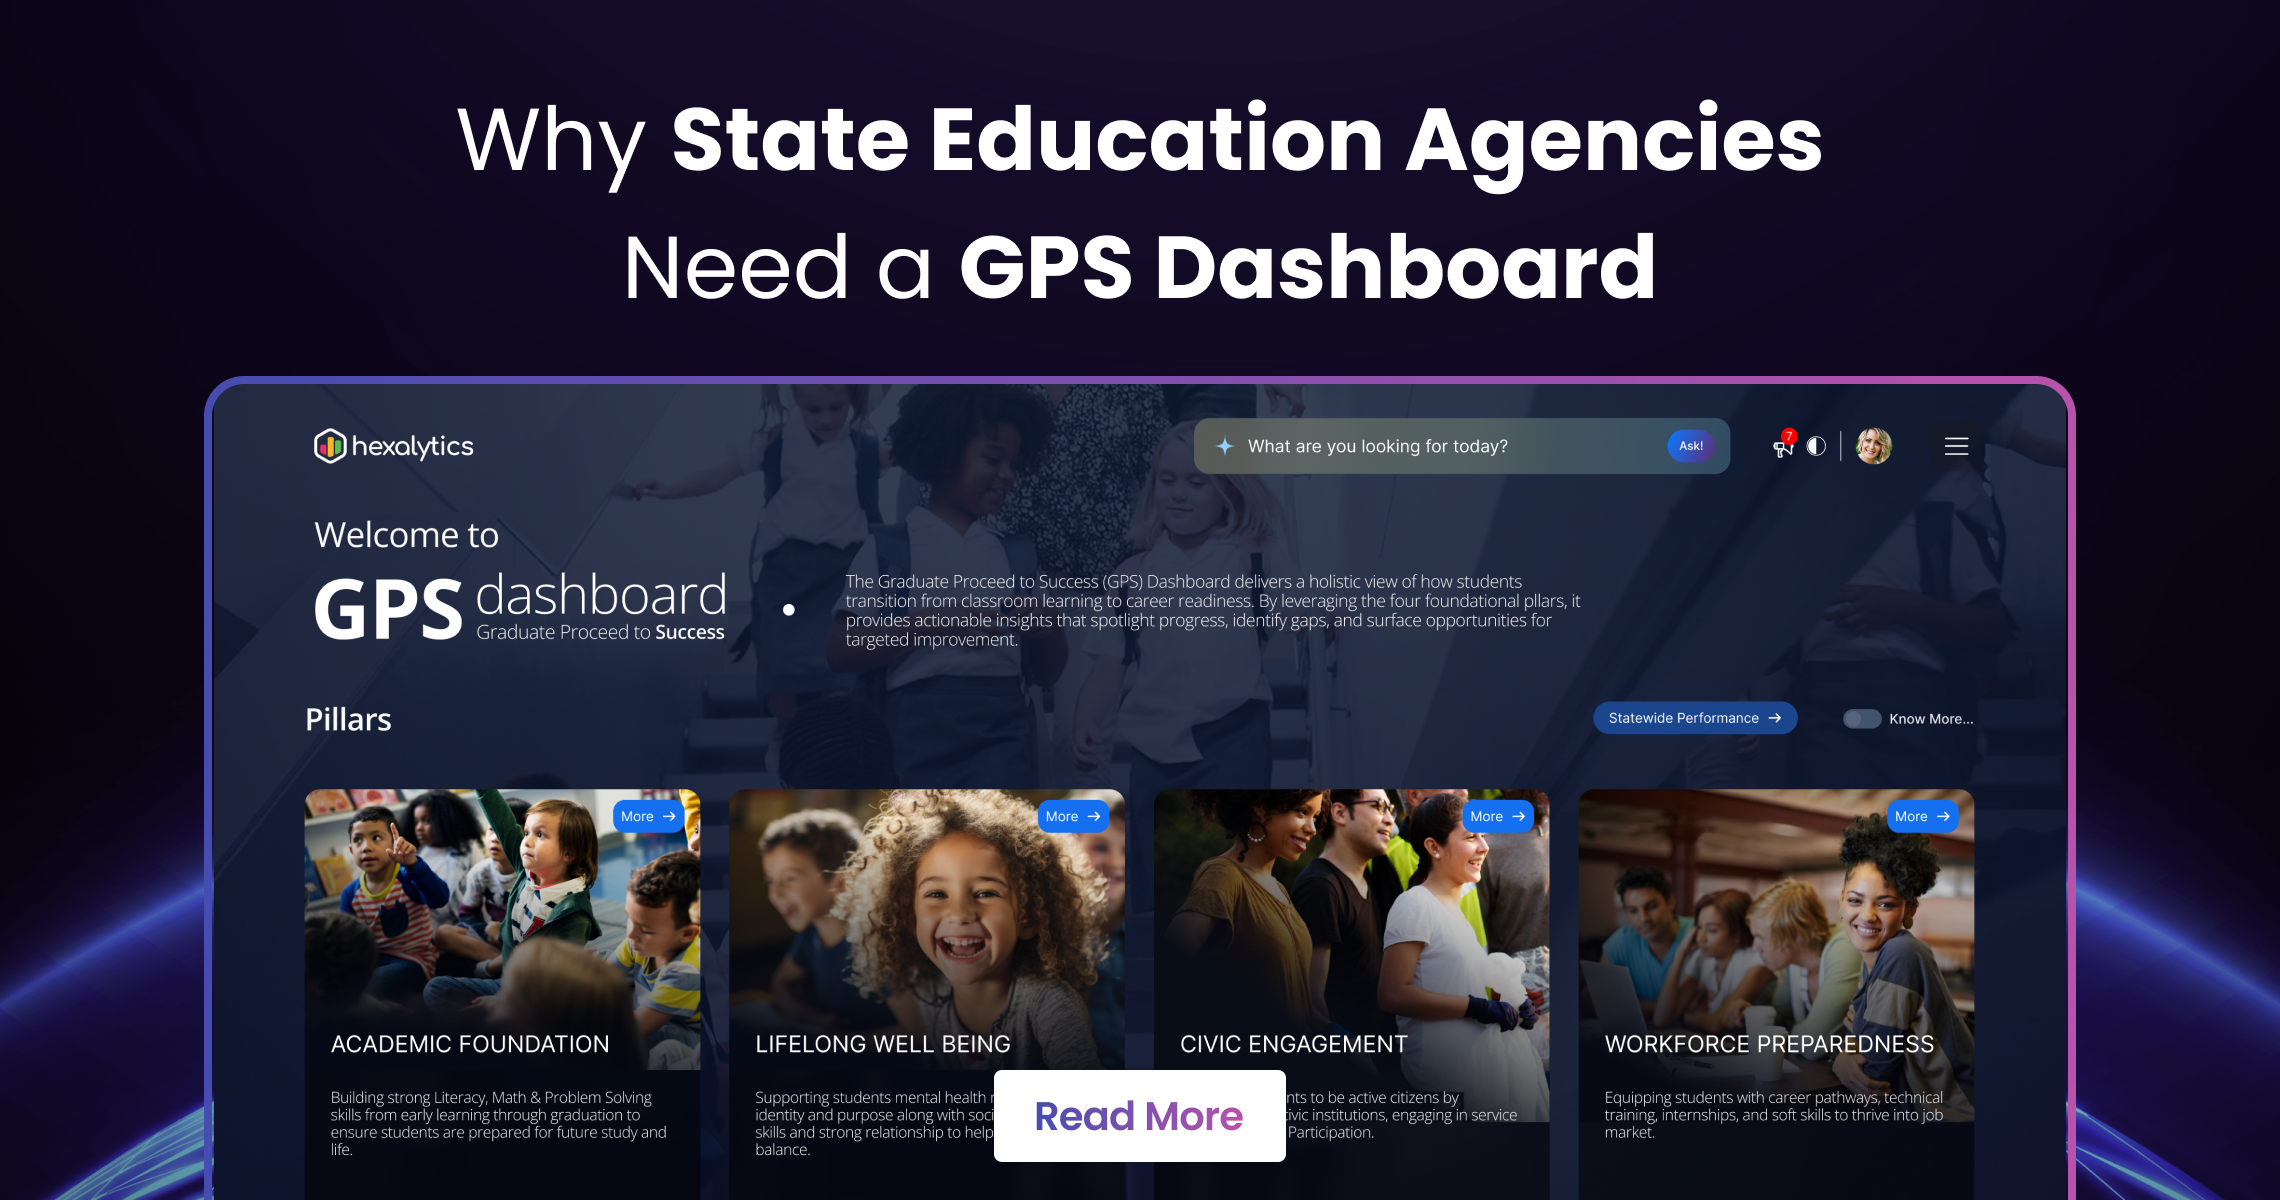
The GPS Difference: A Holistic, 360-Degree View
The GPS Dashboard solve these problems by providing a unified, comprehensive, and longitudinal view of the student journey, tracking progress across four essential pillars of success.
1. Academic Foundation
This pillar tracks core learning outcomes from early grades through graduation. It moves beyond a single test score by incorporating metrics like Enrollment, Attendance & Absenteeism, and Dropout rates alongside traditional Assessments and Graduation rates. A student with high test scores, but chronic absenteeism is flagged, ensuring a more accurate picture of their academic stability.
2. Lifelong Well-Being
Success in school and life is inextricably linked to mental and physical health. This pillar brings essential, often-siloed data to the forefront, including Student Discipline, Poverty & Hunger Rates, and Health Insurance Coverage. By seeing these indicators, leaders can understand systemic challenges that impact learning and direct resources toward vital social-emotional and health support.
3. Civic Engagement
Preparing active citizens is a core part of the educational mission. This pillar measures participation in programs that foster leadership and civic mindedness, such as Leadership Program Participation and Pre-Apprenticeship Participation. It validates the importance of soft skills and community involvement in a student’s holistic development.
4. Workforce Preparedness
The ultimate measure of K-12 readiness is a student’s ability to transition successfully to a meaningful post-secondary path. This pillar tracks tangible outcomes related to career success, including College & Career Readiness (AP/IB/DE completion), Graduate Employment & Wages, and Financial Aid Access. This crucial link back to real-world labor market data provides an essential feedback loop for curriculum planning.
Turbocharging Decisions with AI-Powered Intelligence
One of the GPS Dashboard’s most transformative features is its integrated, AI-powered question-and-answer tool. This capability transforms static reports into dynamic, accessible insights.
Instead of spending hours manually analyzing spreadsheets, leaders can simply ask natural-language questions, such as:
- “Show math proficiency by economic subgroup in District A.”
- “Which districts improved graduation rates the fastest this year?”
- “What is the correlation between 3rd-grade reading scores and post-secondary employment in the Delta region?”
The AI delivers instant, data-driven answers, enabling faster, evidence-based decision-making and moving state teams from data collection to data action.
Actionable Intelligence for All Stakeholders
The GPS Dashboard is not just a reporting tool; it is a system-wide platform for improvement and transparency, featuring:
Pillar Insight Pages for deep dives into specific student groups or schools.
A State Benchmarking Tool for side-by-side comparison against state averages and targets
A Public Transparency Mode to foster trust and accountability with families, community members, and policymakers.
By adopting a GPS Dashboard, State Education Agencies move from merely reporting the past to actively guiding the future. They gain the holistic perspective and actionable intelligence necessary to ensure that every graduate is not just certified but truly prepared to proceed to success in their chosen career and civic life.
About Strategic Plan 360 by Hexalytics
We help district leaders turn goals into measurable progress. Our dashboards unite academics, operations, finance, and HR in one clear view, enabling leaders to track goals, align resources, and build accountability. Grounded in clarity and transparency, our approach helps every team stay aligned and focused on meaningful outcomes for students.
Empower your team with the real-time, 360° insight needed to ensure every graduate is ready to succeed.
FAQs
Who is the primary user of the GPS Dashboard?
The primary users are State Education Agency (SEA) leaders, Superintendents, District Administrators, and school principals. However, the Public Transparency Mode allows families, community members, and policymakers to view statewide and local outcomes.
What are the advantages of the AI-Powered Insights tool?
The AI tool allows users to ask complex questions in natural language (e.g., “Compare chronic absenteeism in schools with high vs. low civic engagement participation”) and receive instant, data-driven answers. This saves hours of manual data analysis, allowing staff to focus on strategy and intervention.
How does GPS ensure data privacy and security?
The dashboard is designed for state-level data volumes and privacy requirements. It uses secure protocols and access controls, and the Public Transparency Mode is specifically designed to show aggregated, secure views of data, protecting individual student information.
Can the GPS Dashboard track outcomes after students graduate?
Yes. The Workforce Preparedness pillar includes key post-secondary metrics, such as Graduate Employment & Wages and data on Student Employment During College, providing a critical longitudinal view of career success that current K-12 data tools often lack.
