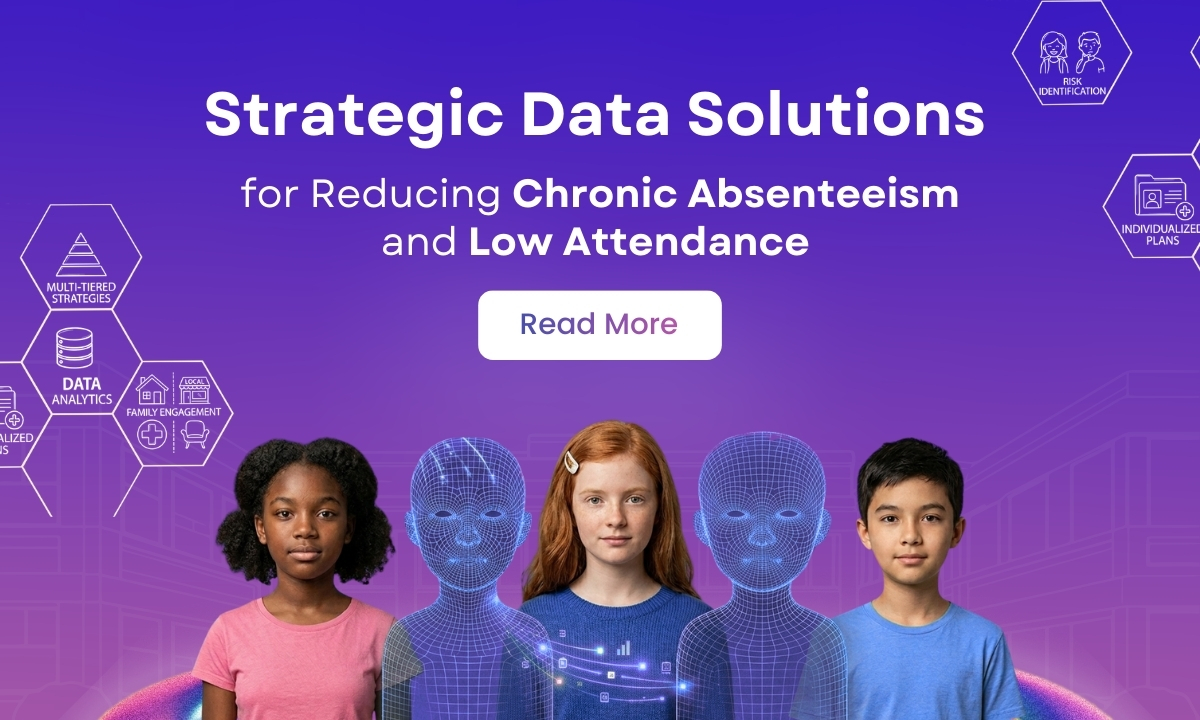
Shifting Toward a Diagnostic Infrastructure
Traditional attendance monitoring often functions in a retrospective capacity, flagging students only after significant learning loss has occurred. Insights from the Brookings Institution underscore that consistent presence is the fundamental prerequisite for all academic achievement. When this foundation is compromised, a diagnostic approach is essential to uncover the root causes.
1. Synthesizing Complex Data Ecosystems
Structural barriers frequently reside in the gaps between departmental data silos. An attendance dip might correlate with a change in a student’s residential status, a recurring health challenge, or a disruption in specialized transit services.
The integration of academic, behavioral, and socio-economic indicators into a unified source of truth provides the clarity necessary to bridge these gaps. Within this centralized environment, leaders identify hidden patterns, such as the direct impact of bus route reliability on specific student populations. This transition shifts the institutional focus from monitoring “truancy” to optimizing the district’s supporting infrastructure.
2. Implementation of Predictive Early Warning Systems
- The strategic allocation of social work resources to high-risk student clusters.
- The initiation of relational outreach for families experiencing early signs of instability.
- Real-time monitoring of Tier 1 and Tier 2 intervention efficacy to ensure resource optimization.
3. Visualizing Regional and Demographic Equity
The ability to disaggregate attendance data by any demographic or geographic variable is crucial for informed decision-making. High-level visualization tools help leadership examine whether a specific neighborhood absenteeism is tied to localized barriers, such as a lack of school-based health clinics or linguistic gaps in family communications. This granularity ensures that sustained investment is directed toward areas with the highest potential for impact.
Fostering Alignment Through Continuous Improvement
By utilizing a comprehensive strategic dashboard, districts move beyond isolated initiatives and adopt a cycle of Continuous Improvement. This transparency ensures that stakeholders at every level from the cabinet to the campus possess a shared understanding of progress and a clear map for future growth.
Strategic Capabilities for Leadership:
| Strategic Pillar | Impact on Student Success |
|---|---|
| Integrated Insights | Rapid identification of attendance fluctuations within 24–48 hours for immediate support. |
| Predictive Modeling | Early Warning Systems that flag risk profiles long before they become administrative crises. |
| Equity Filters | Recognition of structural barriers affecting specific student subgroups or geographic zones. |
| Impact Tracking | Quantifiable measurement of the ROI on community partnerships and transit initiatives. |
Data as a Catalyst for Access
Solving the absenteeism challenge requires a fundamental recognition of the issue as one of systemic access. Our solutions provide the precision and foresight necessary to meet families where they are. By identifying and dismantling the structural barriers to attendance, districts can build a resilient support system that ensures every student has a reliable path to the classroom.
About Strategic Plan 360 Powered by Hexalytics
StrategicPlan360, powered by Hexalytics, is an AI-powered analytics platform built for K–12 district leaders. With over a decade of experience supporting state and district agencies, it transforms complex data into real-time insight for strategic planning and accountability.
Our AI powered dashboards align goals, metrics, and actions across departments, giving superintendents and boards the clarity to lead with confidence. Backed by deep education expertise, we deliver secure, scalable reporting that drives measurable progress.
Take Action on Student Attendance
FAQs
What is the difference between chronic absenteeism and truancy?
Chronic absenteeism measures the total days missed (excused and unexcused), focusing on lost instructional time. Truancy typically refers only to unexcused absences and is often treated as a compliance or legal matter.
How does AI help in reducing chronic absenteeism?
AI identifies subtle patterns in student data—such as specific days missed or correlations with transit delays—to predict which students are at risk of becoming chronically absent before they hit critical thresholds.
Can the system predict absenteeism before it becomes a crisis?
Yes. By tracking micro-trends—like a shift from 100% to 92% attendance—the AI flags students trending toward chronic status. This allows for proactive intervention weeks before a student hits state-mandated at-risk thresholds.
How do dashboard insights support equity in education?
By disaggregating attendance data by race, zip code, and disability status, dashboards reveal where structural barriers like “transportation deserts” or health service gaps are disproportionately affecting specific student groups.
How do these insights measure the ROI of district programs?
Leadership can overlay specific interventions—such as new mentorship programs or shuttle services—against real-time attendance growth. This transparency reveals which initiatives are driving results, allowing for smarter budget reallocation.