How District Leaders Are Reframing Planning and Accountability for 2026

US school districts are entering a period where leadership effectiveness is increasingly defined by alignment rather than expansion. Enrollment patterns are shifting, financial assumptions are harder to lock in, workforce dynamics are evolving, and community expectations continue to rise. In this environment, district leaders are not only managing change, but they are also being asked to demonstrate clarity, foresight, and discipline in how strategy is executed.

What distinguishes high-performing districts today is not access to more data or more tools, but the ability to connect planning, budgeting, and performance into a coherent leadership view.

Navigating Enrollment Volatility with Greater Precision

Enrollment trends have become less predictable and more consequential for district operations. Demographic shifts, migration patterns, school choice expansion, and attendance variability are creating year-to-year fluctuations that directly affect staffing models, facility utilization, and funding assumptions.

District leaders are moving away from static enrollment projections and toward scenario-based planning that reflects multiple possible outcomes. This approach allows leadership teams to understand how changes in enrollment affect class sizes, staffing allocations, transportation routes, and program sustainability before decisions are locked in.

Dashboards that integrate enrollment data with staffing and financial models give districts the ability to anticipate impact rather than react to it, supporting more stable and defensible planning decisions.

Strengthening Budget Confidence Amid Cost Pressures

Budgeting has become a strategic exercise rather than an annual compliance process. Rising costs across transportation, facilities maintenance, benefits, instructional materials, and technology refresh cycles are placing sustained pressure on operating budgets. At the same time, districts are expected to preserve instructional quality, maintain services, and support diverse student needs.

Executive teams are increasingly focused on understanding not just where money is spent, but how spending aligns with strategic priorities and measurable outcomes. Budget dashboards that connect expenditures to goals, programs, and performance indicators enable leaders to assess trade-offs clearly and communicate decisions with confidence.

This level of financial visibility supports more disciplined resource allocation and strengthens trust with boards and communities.

Aligning Workforce Planning with Long-Term Strategy

Staffing remains one of the most complex and sensitive areas of district leadership. Recruitment challenges, retirements, compensation expectations, and role specialization are reshaping workforce planning across instructional and operational functions.

Rather than relying solely on historical staffing ratios, districts are using data to align workforce decisions with enrollment trends, program demand, and strategic priorities. This includes understanding where attrition may occur, which roles are critical to sustain, and how staffing changes influence instructional delivery and student support.

Integrated dashboards that connect HR data with enrollment, budgeting, and academic metrics allows leaders to evaluate workforce decisions through a strategic lens rather than in isolation.

Modernizing Facilities and Operations With Strategic Insight

Facilities and operations have moved higher on the leadership agenda as districts manage aging infrastructure, safety requirements, accessibility standards, and energy efficiency expectations. Capital planning now requires coordination across finance, operations, and instructional leadership to ensure investments support long-term district goals.

Visibility into facility conditions, maintenance schedules, capital projects, and associated costs helps districts prioritize investments and demonstrate responsible stewardship. Operational dashboards bring structure to these conversations by connecting physical assets with financial planning and strategic outcomes.

This approach supports proactive maintenance, clearer capital planning, and more effective communication with stakeholders.

Elevating Accountability and Board Governance

Boards and communities are asking more informed questions about progress, outcomes, and return on investment. Leaders are expected to show how strategic plans translate into measurable results across academics, operations, and finance.

Traditional reporting cycles often lag behind decision needs, limiting their value in governance conversations. Executive dashboards that provide real-time or near-term visibility into key indicators help leadership teams guide board discussions with evidence rather than anecdotes.

Dashboard solutions by Strategic Plan 360, powered by Hexalytics, serve as the platform that brings these executive dashboards together, enabling districts to track progress against strategic goals while maintaining a clear, leadership-ready narrative.

Reducing Data Fragmentation Across the Organization

One of the most persistent challenges districts face is fragmentation across systems. Enrollment, finance, HR, academics, operations, and student support data often live in separate platforms, creating gaps in understanding and delays in insight.

Districts are increasingly investing in unified analytics environments that consolidate data into a single, trusted view. This unification supports faster analysis, reduces manual reporting, and ensures that leadership teams are working from consistent information.

Hexalytics dashboard solutions are designed to support this unification, translating complex data landscapes into executive-level insight that informs planning and action.

Turning Strategic Intent into Measurable Progress

Strategic plans remain central to district vision, but their value is realized through execution and monitoring. Leaders are prioritizing tools that allow them to track initiatives, measure progress, and adjust course as conditions evolve.

Modern dashboards connect goals, metrics, timelines, and ownership in ways that support accountability without adding administrative burden. This visibility enables leadership teams to stay aligned, identify risks early, and sustain momentum across multi-year initiatives.

Leading With Clarity Into 2026

As districts look toward 2026, the emphasis is shifting from expansion to precision. Leaders are focused on making informed decisions, aligning resources with priorities, and communicating progress with confidence.

Enterprise-grade dashboards play a critical role in this shift by providing clarity across enrollment, budgeting, workforce planning, facilities, and strategic execution. With the right visibility, districts are better positioned to lead proactively, adapt responsibly, and deliver lasting value for students and communities.

Strategic Plan 360, powered by Hexalytics, supports this leadership journey by enabling districts to move from planning to performance with confidence and control.

About StrategicPlan360

Data-Driven Leadership. District-Wide Clarity.

StrategicPlan360, powered by Hexalytics, is an AI-powered analytics platform purpose-built for K–12 district leaders. With over a decade of experience supporting state and district education agencies, our platform transforms complex data into real-time insight that drives strategic planning, accountability, and progress monitoring.

We’ve partnered with districts to deliver results that go beyond compliance. Our intelligent dashboards align goals, metrics, and actions across departments, empowering superintendents, department heads, and school boards with the clarity they need to lead effectively.

It’s a proven solution shaped by years of collaboration with educators, data leaders, and policymakers. Backed by Hexalytics’ deep domain expertise, we bring smart reporting, secure governance, and scalable innovation to every level of K–12 leadership.

Take the Next Step in Strategic Leadership

Is your district equipped to align strategy, planning, and accountability in real time for 2026?

Schedule a demo to explore how dashboards support informed decision-making.

FAQs

1. How can school districts respond to enrollment changes?

School districts can use integrated dashboards to model enrollment scenarios and align staffing, budgets, and facilities with shifting student demand.

Executive dashboards improve budgeting by linking spending, programs, and outcomes, giving leaders clear visibility into financial trade-offs.

Districts use strategic dashboards to track goals, monitor performance, and support board-level accountability with real-time insight

Data integration creates a single, trusted view across enrollment, finance, HR, and operations, enabling faster and more confident decisions.

Dashboards turn complex data into executive-ready insight, helping leaders align strategy, resources, and results.

Rethinking Strategic Execution Beyond the 5-Year PDF

In the current K-12 landscape defined by fluctuating enrollment, teacher shortages, and the rapid integration of AI, the traditional five-year planning cycle is no longer a safety net; it’s a bottleneck. The challenge facing district leaders is not the absence of planning, but the absence of a system that translates strategy into sustained, measurable execution. Research from McKinsey & Company and academic institutions indicates that between 60% and 90% of well-formulated strategies fail during the implementation phase.

For school districts, this gap represents missed opportunities for student intervention, inefficient resource allocation, and a slow erosion of community trust. The(https://hbr.org/) estimates that the return on investment (ROI) from traditional planning approaches can be as low as 34% or less.

These outcomes consistently point to the same root issue: execution breakdowns, not flawed strategic intent. To deliver on the promise of student success, district leaders must shift their focus from the static artifact of Strategic Planning to the dynamic engine of Strategic Execution.

The PDF Gap: Why Traditional Plans Stagnate

When a district’s goals are locked in a static document, they become disconnected from the daily operational reality of the classroom. These challenges are not isolated issues; they are symptoms of managing strategy through static, document-based models.

  • Data Latency: Most five-year plans rely on “Lagging Indicators” (like year-end state test scores). By the time the data is analyzed and the plan is adjusted, the student cohort has already moved on.
  • The “Folder Effect”: Without a mechanism for tracking, strategic goals often get buried under the “Whirlwind” of daily operations—bus schedules, disciplinary issues, and facilities management.
  • Lack of Agility: According to Gartner research, two-thirds of corporate and public sector strategies fail due to poor execution, often because the organization cannot pivot when external conditions change.

For school boards and superintendents, this translates into delayed outcomes, reduced credibility, and limited ability to adapt when conditions shift.

Strategic Planning vs. Strategic Execution: The Core Differences Consultant Model is Failing Districts

Understanding the distinction between planning and execution is critical for leadership teams seeking to move from intent to impact.

Feature Strategic Planning (The Old Way) Strategic Execution (The New Way)
Format Static PDF / Print-out Dynamic, Cloud-based Dashboard
Timeline Fixed 5-year intervals Continuous, iterative cycles
Measurement Annual reporting Real-time Key Performance Indicators (KPIs)
Accountability General (The District) Specific (Owners and Contributors)

The shift to platforms which provide dashboard solutions allows districts to transform these high-level aspirations into actionable, tracked tasks. Instead of wondering if a literacy initiative is working in year three, leaders can see progress in month three.

The Technical Solution: Strategic Execution Platforms

The primary obstacle to closing the execution gap is often technical. Districts are data-rich but insight-poor. To resolve this, modern school systems are adopting enterprise-level analytical solutions that integrate disparate data streams into a single, unified view. These platforms provide dashboard solutions that are powered by advanced data engineering to ensure information integrity and governance.

The Power of Data-Informed Agility

In the U.S. education sector, the demand for transparency is at an all-time high. Taxpayers and parents are no longer satisfied with the vague promises of “excellence.” They want to see the ROI on specialized programs and COVID-era recovery funding.

Market data from McKinsey & Company suggests that the most successful public institutions are those that decentralize data, making it accessible to those who actually implement the strategy—principals and department heads.

By leveraging advanced data visualization, districts can move beyond spreadsheets. Modern dashboard solutions unify district data into a single leadership view When Hexalytics connects data across the district, the “5-Year PDF” is replaced by real-time strategic oversight. You aren’t just planning for 2029; you are executing for Monday morning.

3 Steps to Modernize Your District’s Strategy ties.

Districts that successfully modernize strategic execution treat these shifts as organizational practices rather than one-time improvements.

1. Quantify the Qualitative

Don’t just aim to “Improve Culture.” Define what that looks like in numbers. Is it a 10% reduction in teacher turnover? A 15% increase in positive parent survey responses? Use Strategic Plan 360 solution to assign these metrics to specific team members.

2. Implement “Pulse Checks” over “Annual Reviews”

The world moves too fast for annual updates. Effective districts hold monthly or quarterly “Strategy Reviews” where the only agenda item is: “Are we on track with our strategic initiatives, and if not, what resource shift is required?”

3. Visualize the Journey

Transparency breeds trust. When you use Hexalytics solution to create public-facing or board-facing dashboards, you demonstrate a commitment to evidence-based leadership. It moves the conversation from “I think we are doing well” to “The data shows we are making progress.”

The Road Ahead: From Static Plans to Living Systems

The transition from a static PDF strategic plan to a dynamic execution system is not merely a software upgrade; it is a fundamental re-engineering of how school districts operate. It requires a commitment to data literacy, a willingness to be transparent about progress, and an agile leadership mindset that prioritizes “sprints” over “marathons”.

As districts navigate the complexities of 2025 and beyond, those that thrive will be the ones that have built a “data fabric” to unify their intelligence ecosystem. By leveraging Hexalytics analytical solutions platform, superintendents can ensure that their vision becomes action, their action becomes measurable, and their measurement leads to improved results.

The role of the five-year plan is evolving. The age of real-time strategic execution has begun. For district leaders, the mandate is clear: move beyond the plan and start driving change.

About StrategicPlan360

Data-Driven Leadership. District-Wide Clarity.

StrategicPlan360, powered by Hexalytics, is an AI-powered analytics platform purpose-built for K–12 district leaders. With over a decade of experience supporting state and district education agencies, our platform transforms complex data into real-time insight that drives strategic planning, accountability, and progress monitoring.

We’ve partnered with districts to deliver results that go beyond compliance. Our intelligent dashboards align goals, metrics, and actions across departments, empowering superintendents, department heads, and school boards with the clarity they need to lead effectively.

It’s a proven solution shaped by years of collaboration with educators, data leaders, and policymakers. Backed by Hexalytics’ deep domain expertise, we bring smart reporting, secure governance, and scalable innovation to every level of K–12 leadership.

Take the Next Step Toward Strategic Execution

Is your strategic plan actively guiding day-to-day decisions across the district?
Schedule a demo to see how data-driven dashboards support execution at every level.

FAQs

1. What is the difference between strategic planning and strategic execution in K–12 districts?

Strategic planning defines long-term goals, while strategic execution ensures those goals are actively monitored, measured, and adjusted through real-time data and accountability.

Five-year plans often fail because they rely on static documents, delayed reporting, and limited visibility, making it difficult to adapt to enrollment, staffing, and operational changes.

Districts improve execution by using integrated dashboards that track initiatives, assign ownership, and connect performance data to strategic priorities.

Dashboards provide real-time insight into progress, risks, and outcomes, enabling superintendents and boards to move from annual reviews to continuous strategic oversight.

Data integration creates a unified view across academics, finance, HR, and operations, allowing leaders to make informed decisions and maintain accountability.

Why Districts Are Automating Enrollment Planning to Cut Costs  

The American K-12 landscape is currently navigating a demographic “perfect storm.” According to projections from the National Center for Education Statistics (NCES), 34 states will experience significant student enrollment declines between 2025 and 2031. For 11 of those states, the drop will exceed 5%, driven largely by a birth rate that has been in steady decline since its 2007 peak. 

For district leaders, this isn’t just a statistical curiosity—it is a fiscal emergency. In many states, funding follows the student, meaning every empty desk represents a direct hit to the General Fund. Historically, the “standard operating procedure” for managing this has been to hire external enrollment consultants. These firms often charge six-figure fees to produce a static, 100-page PDF that is effectively obsolete at the moment it is delivered.

As we move into 2026, a more efficient strategy is emerging: the shift from consultant-led snapshots to internal, dashboard-driven continuity

The Dichotomy of Modern Enrollment

There is a strange divide in current district sentiment. While data points toward decline, a McKinsey & Company survey noted that 51% of district respondents actually expect their enrollment to increase. This gap between projection and perception often leads to unexpected budget tightening” when the reality of empty classrooms sets in. 

One district leader aptly summarized the challenge: “The problem we are actively solving is how to fund increased spending needs in the face of flat or declining funding.” 

To bridge this information gap, school districts have historically turned to one expensive solution: the enrollment consultant.

Why the Consultant Model is Failing Districts

Traditional enrollment consultants typically address three core questions: 

1.Which schools are growing or shrinking?
2.Where is our capacity underutilized?
3.Should we change boundaries or consolidate programs?

While these questions are vital, the delivery of the answers is often the problem. Consultant studies are “one-and-done” engagements. If a major housing development is delayed or a new charter school opens nearby three months after the report is filed, the district must often re-contract the consultant for a “refresh”—at an additional cost.

Six Ways an Enrollment Dashboard Eliminates Hidden Costs

1. Eliminating the Consultant Tax

By bringing data analysis in-house, districts can avoid recurring six-figure consulting fees. Instead of waiting months for a report, leaders have real-time visibility into trends.

  • Cost Impact: Reduces repeat engagements and keeps intellectual property (data insights) within the district rather than locked in a vendor’s proprietary model.

2. Preventing Reactive Facilities Decisions

Late visibility into enrollment drops often leads to “emergency” closures or rushed consolidations, which are both politically toxic and operationally expensive. Conversely, Hanover Research highlights that data analytics allow for “deliberate planning” rather than panicked reactions.

  • Cost Impact: Avoids the costs of overbuilding or maintaining underutilized, “phantom” facilities.

3. Precision Staffing and FTE Alignment 

Staffing accounts for roughly 80-85% of most district budgets. The dashboard surfaces enrollment declines before staffing contracts are locked in for the following year.

  • Cost Impact: Reduces overstaffing by identifying grade-level shifts early, allowing for natural attrition rather than painful mid-year layoffs.

4. Proactive Special Education Budgeting

Special education enrollment often follows different trends than the general population but carries much higher per-pupil costs.

  • Cost Impact: By tracking these specific trends alongside general enrollment, Hexalytics helps districts adjust budgets for specialized staff and services before a fiscal “surprise” occurs.

5. Protecting Per-Pupil Revenue through Intervention

When a dashboard shows exactly where students are leaving—and to which competitors—districts can intervene. Whether it’s a specific program that needs revitalizing or a school boundary that needs adjustment, earlier intervention stabilizes the “revenue leakage.”

  • Cost Impact: Every student retained represents a preserved unit of state funding.

6. Transitioning to Living Analysis

In the current era of “AI-driven ERP and SIS systems,” as noted by iTech India, administrative efficiency is no longer optional. A dashboard provides a central source of truth for the Board, the Superintendent, and the Community.

  • Cost Impact: Lower Total Cost of Ownership (TCO) compared to maintaining fragmented spreadsheets and paying for manual report generation.

The Bottom Line: Resilience through Efficiency

The most resilient school districts in 2026 are moving away from static, “one-off” consulting and toward internal efficiency. While consultants answer your questions once, an integrated Enrollment Dashboard answers them every single morning. This seamless integration ensures that your district isn’t just tracking enrollment declines but actively reversing them through automated optimization and data-driven community outreach.

Hexalytics Digital Advertising Services: Hexalytics delivers AI-powered enrollment marketing that helps districts connect with the right families at the right moment. By feeding dashboard insights into our predictive analytics and intelligent targeting systems, we continuously refine digital campaigns to improve reach and engagement.

About StrategicPlan360, Powered by Hexalytics

Clarity for Enrollment-Driven Leadership.

StrategicPlan360 is an AI-powered analytics platform built for K–12 district leaders navigating enrollment change. Powered by Hexalytics, it connects real-time enrollment insights with strategic goals, resource planning, and progress monitoring in one unified view.

With over a decade of experience supporting education agencies, the platform helps districts move from static plans to continuous, data-informed decision-making. Integrated dashboards align enrollment trends with staffing, budgeting, and program priorities, giving superintendents, leadership teams, and boards the clarity they need to act with confidence.

Is your district ready to move from reactive reports to proactive strategy?

Would you like a personalized walkthrough of how our solutions can integrate your district’s specific data to forecast your next five years? 

FAQs

1. Why use a dashboard instead of a consultant?

Consultants provide a “snapshot” report that is often outdated within months. Enrollment Dashboard offers a live, automated link to your data, providing continuous insights without the recurring six-figure consulting fees.

Staffing is your largest expense. By surfacing enrollment trends months before contracts are locked, you can align Full-Time Equivalent (FTE) counts with actual student demand, avoiding both overstaffing and last-minute emergency hires.

Yes. The dashboard tracks SPED populations separately, allowing you to forecast high-cost service needs early. This prevents mid-year budget “shocks” and ensures resources are allocated precisely where they are needed.

Absolutely. It identifies exactly where students are leaving . This “early warning” allows leadership to intervene, improve programs, and retain the per-pupil funding that supports the district.

No. Unlike manual spreadsheets, it integrates directly with your existing Student Information System (SIS). It replaces fragmented reporting with a “single source of truth,” reducing the administrative workload for your central office team.

Proving ROI in the Post‑ESSER Era for Smarter Fiscal Leadership

As the sun sets on the historic infusion of federal COVID-19 relief funds, U.S. school districts are waking up to a stark new reality. The Elementary and Secondary School Emergency Relief (ESSER) funds, which provided nearly $190 billion to stabilize K-12 education, have reached their final liquidation deadlines. For district leaders, 2026 is no longer about “spending for recovery”; it is about proving the value of every dollar remaining. The 2026 academic cycle represents more than just another budget season; it is a fundamental test of institutional resilience.

Market research from the SETDA State EdTech Trends Report highlights a chilling statistic: 32% of education leaders now list funding as their biggest unmet need, a significant jump from 25% just a year ago (EdTech Magazine, 2025). The modern US school district is navigating an unprecedented “funding gap.” Research indicates that only 6% of states currently have durable plans to sustain initiatives previously funded by federal relief dollars, a sharp decline from 27% in 2024

As the “fiscal cliff” looms, Superintendents, CFOs, and CIOs must transition from a mindset of emergency procurement to one enterprise-level fiscal transparency.

In this era of scarcity, Strategic Plan 360, powered by Hexalytics, provides the precision-engineered dashboard solutions required to navigate gap and prove undeniable Return on Investment (ROI) to school boards and taxpayers alike.

The Fiscal Cliff: Why "Business as Usual" is a Risk

For the past three years, districts have used ESSER funds to patch holes, upgrade HVAC systems, and jumpstart 1:1 device initiative. However, McKinsey & Company warns that as these federal dollars evaporate, many districts face a 4% decline in total per-pupil funding in the 2026-27 school year.

The danger is not just the loss of funds, but the loss of progress. Without a way to prove which programs of tutoring, digital curricula, or mental health interventions actually moved the needle on student achievement, districts risk cutting the very initiatives that drive success.

Proving Academic ROI (A-ROI)

The business world measures ROI in profit. In education, we measure it in outcomes per dollar. According to the District Management Group (DMGroup), A-ROI allows leaders to break down silos between finance and academics.

Dashboard Solutions by Strategic Plan 360 automates this process. By integrating your Finance data with Student Information Systems (SIS), our solutions allow you to visualize the cost-effectiveness of every program in real-time.

The Role of Unified Intelligence in Strategic Execution

A primary obstacle to proving ROI is fragmented data. Most districts manage strategic plans such as 50-page PDFs that sit on a shelf, disconnected from the daily flow of Student Information Systems (SIS), HR, and Finance databases. This “data noise” prevents leaders from seeing sudden shifts in attendance or academic performance in time to intervene.

In 2026, the “indispensable architects” of education are those who unify these systems into a single strategic execution platform. By moving from “reporting” (what happened) to “foresight” (what will happen), districts can build radical trust with their communities.

Strategic Pillars for Post-ESSER Fiscal Transparency

To secure future local bonds or state increases, district leaders must demonstrate a “Level Up” in their operational maturity. Hexalytics provides an enterprise-friendly ecosystem that meets your district’s needs.

1. The Finance Transparency Dashboard: Building Public Confidence

Public trust is the currency of the post-ESSER world. Our Finance Transparency Dashboard transforms complex spreadsheets into executive-friendly visualizations. District leaders use these to visualize spending and resource use clearly. This allows the board to see the “big picture” of budget alignment and equity through evidence-based insights rather than assumptions

  • Visualize: Show exactly where tax dollars go.
  • Simplify: Move away from 300-row Excel sheets to intuitive bar charts and pie graphs.
  • Amplify: Build a narrative of fiscal responsibility that resonates with the community.

2. Asset Fusion 360: Managing the Chromebook Crisis

One of the largest needs in 2026 is the device refresh cycle. During the pandemic, 92% of districts bought hardware like Chromebooks (Magic EdTech, 2024). Now, those devices are reaching an end-of-life. Asset Fusion 360 gives you full lifecycle visibility from purchase to retirement ensuring you aren’t paying for licenses you don’t use or losing track of high-value inventory.

3. AI-Powered Executive Dashboards: High-Impact Leadership

As planning grows more complex, district leaders must move beyond reactive reporting and lead with proactive strategy. Our AI-Powered Executive Dashboards trusted by districts like Knox County Schools and Hernando School District—unify academics, finance, and operations into one high-level command center. These dashboards use Predictive Analytics to spot risks early and AI Insights to deliver proactive recommendations. It is an enterprise-level “Custom Fit” that ensures every dollar is funneled toward your district’s most critical KPIs, providing the clarity needed.

Conclusion: Leading with Clarity

The transition from pandemic-era relief to fiscal discipline is a unique leadership opportunity. By leveraging educational intelligence to track Academic ROI and ensure finance transparency, districts can move from “firefighting” to visionary leadership. Clarity is the new leadership advantage, and in 2026, those who can turn complex data into student success stories will be the ones who thrive

By moving from fragmented silos to a 360-degree data ecosystem, you can prove that your district is a steward of both student potential and public funds.

About StrategicPlan360 Powered by Hexalytics:

Data-Driven Leadership. District-Wide Clarity.

StrategicPlan360, powered by Hexalytics, is an AI-powered analytics platform purpose-built for K–12 district leaders. With over a decade of experience supporting state and district education agencies, our platform transforms complex data into real-time insight that drives strategic planning, accountability, and progress monitoring.

We’ve partnered with districts to deliver results that go beyond compliance. Our intelligent dashboards align goals, metrics, and actions across departments, empowering superintendents, department heads, and school boards with the clarity they need to lead effectively.


It’s a proven solution shaped by years of collaboration with educators, data leaders, and policymakers. Backed by Hexalytics’ deep domain expertise, we bring smart reporting, secure governance, and scalable innovation to every level of K–12 leadership. 

Take the Next Step Toward Fiscal Clarity

Is your district prepared to prove its ROI in 2026? Don’t wait for the next audit to find out where your gaps are.

Schedule your Demo today and see how we can power your district’s Proven Performance.

FAQs

1. What is the ESSER fiscal cliff?

The ESSER cliff is the 2026 expiration of pandemic relief funds, leaving school districts with a significant funding gap. Leaders must now prove the value of every dollar to maintain essential student programs.

Academic ROI measures student outcomes per dollar spent. By linking finance data with student performance, districts can identify which programs (like tutoring or mental health) are actually improving results.

Transparency builds public trust. Using visual dashboards to show where tax dollars go helps districts secure future local bonds and state funding by proving responsible fiscal management.

AI-powered dashboards use predictive analytics to spot budget risks and student performance gaps early. This allows leaders to move from “reactive” reporting to “proactive” strategic planning.

With pandemic-era Chromebooks reaching end-of-life, districts use Asset Fusion 360 for lifecycle tracking. This prevents paying for unused licenses and ensures a clear plan for hardware replacement costs.

Why State Education Agencies Need a GPS Dashboard 

For decades, state education agencies (SEAs) have relied on a limited set of metrics primarily with graduation rates and standardized test scores to gauge student and school success. While these data points are important, they offer only a narrow, rearview-mirror perspective. The modern mandate of education, however, is to prepare every learner for college, career, and civic life. To meet this comprehensive goal, SEAs require a tool that is as dynamic, holistic, and forward-looking as the students they serve.

This is the imperative behind the Graduates Proceed to Succeed (GPS) Dashboard: to move beyond basic compliance reporting and provide a true, statewide compass for student and system improvement.

The Pitfalls of a Limited View

The traditional focus on siloed, end-of-year data creates significant challenges for educational leaders:

Delayed Intervention: Data that stops at graduation is too late to inform timely, mid-course corrections. Leaders struggle to pinpoint readiness gaps in an 8th grader’s foundational math skills or a 10th grader’s mental well-being—critical stages where early support makes the biggest difference.

Misaligned Resources: Without a clear, longitudinal view of where students and regions are struggling across multiple dimensions of readiness, state and district leaders cannot align funding and resources to the areas of highest need.

Opaque Communication: Public trust is built on transparency. Simply reporting test scores does not effectively communicate to families and policymakers whether graduates are genuinely prepared for the modern workforce or civic participation.

The GPS Difference: A Holistic, 360-Degree View

The GPS Dashboard solve these problems by providing a unified, comprehensive, and longitudinal view of the student journey, tracking progress across four essential pillars of success.

1. Academic Foundation

This pillar tracks core learning outcomes from early grades through graduation. It moves beyond a single test score by incorporating metrics like Enrollment, Attendance & Absenteeism, and Dropout rates alongside traditional Assessments and Graduation rates. A student with high test scores, but chronic absenteeism is flagged, ensuring a more accurate picture of their academic stability.

2. Lifelong Well-Being

Success in school and life is inextricably linked to mental and physical health. This pillar brings essential, often-siloed data to the forefront, including Student Discipline, Poverty & Hunger Rates, and Health Insurance Coverage. By seeing these indicators, leaders can understand systemic challenges that impact learning and direct resources toward vital social-emotional and health support.

3. Civic Engagement

Preparing active citizens is a core part of the educational mission. This pillar measures participation in programs that foster leadership and civic mindedness, such as Leadership Program Participation and Pre-Apprenticeship Participation. It validates the importance of soft skills and community involvement in a student’s holistic development.

4. Workforce Preparedness 

The ultimate measure of K-12 readiness is a student’s ability to transition successfully to a meaningful post-secondary path. This pillar tracks tangible outcomes related to career success, including College & Career Readiness (AP/IB/DE completion), Graduate Employment & Wages, and Financial Aid Access. This crucial link back to real-world labor market data provides an essential feedback loop for curriculum planning.

Turbocharging Decisions with AI-Powered Intelligence

One of the GPS Dashboard’s most transformative features is its integrated, AI-powered question-and-answer tool. This capability transforms static reports into dynamic, accessible insights.

Instead of spending hours manually analyzing spreadsheets, leaders can simply ask natural-language questions, such as:

  • “Show math proficiency by economic subgroup in District A.” 
  • “Which districts improved graduation rates the fastest this year?” 
  • “What is the correlation between 3rd-grade reading scores and post-secondary employment in the Delta region?” 

The AI delivers instant, data-driven answers, enabling faster, evidence-based decision-making and moving state teams from data collection to data action.

Actionable Intelligence for All Stakeholders

The GPS Dashboard is not just a reporting tool; it is a system-wide platform for improvement and transparency, featuring:

Pillar Insight Pages for deep dives into specific student groups or schools.

A State Benchmarking Tool for side-by-side comparison against state averages and targets

A Public Transparency Mode to foster trust and accountability with families, community members, and policymakers.

By adopting a GPS Dashboard, State Education Agencies move from merely reporting the past to actively guiding the future. They gain the holistic perspective and actionable intelligence necessary to ensure that every graduate is not just certified but truly prepared to proceed to success in their chosen career and civic life.

About Strategic Plan 360 by Hexalytics

We help district leaders turn goals into measurable progress. Our dashboards unite academics, operations, finance, and HR in one clear view, enabling leaders to track goals, align resources, and build accountability. Grounded in clarity and transparency, our approach helps every team stay aligned and focused on meaningful outcomes for students.

Ready to Lead with Clarity?

Empower your team with the real-time, 360° insight needed to ensure every graduate is ready to succeed.

Schedule a live demo and discover how real-time, AI-powered insights can transform your state’s strategic planning.

FAQs

Who is the primary user of the GPS Dashboard?

The primary users are State Education Agency (SEA) leaders, Superintendents, District Administrators, and school principals. However, the Public Transparency Mode allows families, community members, and policymakers to view statewide and local outcomes.

The AI tool allows users to ask complex questions in natural language (e.g., “Compare chronic absenteeism in schools with high vs. low civic engagement participation”) and receive instant, data-driven answers. This saves hours of manual data analysis, allowing staff to focus on strategy and intervention.

The dashboard is designed for state-level data volumes and privacy requirements. It uses secure protocols and access controls, and the Public Transparency Mode is specifically designed to show aggregated, secure views of data, protecting individual student information.

Yes. The Workforce Preparedness pillar includes key post-secondary metrics, such as Graduate Employment & Wages and data on Student Employment During College, providing a critical longitudinal view of career success that current K-12 data tools often lack.

Driving K-12 Excellence and Ensuring District Plan 2026 Success with a Strategic Dashboard

It’s 2026, and the pressure on school districts to make smarter, faster decisions has never been greater. Districts are navigating a post-pandemic world of learning recovery, teacher shortages, and rising expectations for transparency. At the same time, a wave of artificial intelligence (AI) and advanced analytics is reshaping how organizations operate across industries. Education cannot afford to lag behind. Gartner forecasts that by 2027, 50% of all business decisions will be augmented or automated by AI agents, underscoring that data-driven decision-making is becoming the norm. In K-12, the Consortium for School Networking (CoSN) has flagged Generative AI and Data & Information Visualization as top tech enablers for innovation in 2026. The message is clear: to lead effectively in 2026 and beyond, K-12 executives must leverage AI-powered dashboards that turn data into actionable intelligence. This isn’t just a tech upgrade – it’s a strategic imperative for superintendents, CTOs, and school boards aiming to drive success in the coming years. 

The 2026 Imperative: AI and Data Trends in K-12 Education 

Several converging trends make AI-powered dashboards especially urgent for districts right now: 

  • AI’s Rapid Rise in Decision-Making: As noted by Gartner, analysts predict half of decisions will involve AI assistance by the latter part of the decade Education leaders need to build capacity for “decision intelligence” – combining data, analytics, and AI – to keep up. In fact, organizations with AI-literate executives are expected to outperform others by 20% financially for school districts. This means investing in leadership’s understanding of AI tools (like advanced dashboards) can pay real dividends in performance. 
  • Innovation Priorities for 2026: CoSN’s latest advisory report highlights that Generative AI and data visualization tools are among the top three technology enablers for schools in 2026.This reflects a broad consensus that AI-driven analytics and clear visual data insights will power the next wave of school improvement. Districts embracing these tools will be better positioned to innovate in curriculum, operations, and student support, while those that don’t risk falling behind. 
  • From Experimentation to Strategy: Many districts are already testing AI in small ways, but scale remains low. A 2025 CoSN survey found that 57% of school tech leaders were using some AI in their network operations, yet in most cases AI touches 10% or less of processes in other words, AI’s potential in school operations is largely untapped. The same survey reported by govtech that while 76% of district leadership teams are involved in setting direction for AI, only 12% have a clear, defined roadmap for AI deployment 2026 is the year to move from pilot projects to comprehensive strategy – and AI dashboards can be a centerpiece of that strategy, serving as a unifying platform for various AI and data initiatives. 
  • Resource Constraints Demand Efficiency: Districts face tight budgets and staffing challenges going into 2026. CoSN’s panel of experts identified Attracting & Retaining Educators and IT Professionals” as the #1 hurdle for schools in 2026 In this climate, doing more with less is crucial. AI powered dashboards help by automating data collection and analysis that used to eat up staff time. For example, one of the school districts saved hundreds of hours of manual work by consolidating data and automating reports with its new dashboard system. When your data team is essentially “augmented” by AI, your human experts can focus on higher level strategic work rather than wrangling spreadsheets. 

In short, the trends of 2026 point to a perfect storm: exploding data, rising AI capabilities, and intense pressure for results with limited resources. AI-powered dashboards are emerging as the tool to navigate this storm, converting these challenges into opportunities for smarter leadership. 

From Data Deluge to Strategic Insight 

Ask any superintendent or CTO about data, and you’ll likely hear a common refrain: We’re drowning in it. Modern districts collect massive amounts of information – test scores, attendance, digital learning app metrics, budget figures, survey results – but often struggle to synthesize it. We are drowning in data now. No more, please,” wrote one district superintendent candidly. A teacher echoed that sentiment: “We have so much data now that I don’t know if we need any more. We need more training on what to do with the data – how to glean the information we need to make instructional decisions that impact student outcomes. These voices underscore a critical point: it’s not the lack of data that’s the problem; it’s the lack of timely, clear insights. 

  AI-powered dashboards directly tackle this pain point by turning data overload into strategic insight: 

  • Unified Data – A Single Source of Truth: One of the most persistent barriers for districts has been fragmented data systems. In Fulton County Schools, critical information was once distributed across more than 70 separate platforms, limiting leaders’ ability to see systemwide progress. Hexalytics partnered with Fulton to design and deliver a strategic plan dashboard built on an integrated data foundation. Most districts aren’t fully there yet – 61% of tech leaders admit their data is still “dirty and/or siloed – but an AI dashboard project can be the catalyst to finally connect those dots. The payoff is a trustworthy, up-to-date dashboard where everyone from the superintendent to the principals is working off the same numbers. 
  • Automatic Analysis – Insights at a Glance: A well-designed AI dashboard does more than display raw numbers; it interprets them. Modern systems can highlight trends and anomalies automatically, so leaders do not need to be data scientists to benefit. It is like having a virtual data analyst on call. As one district data officer explained, it feels like having a team of analysts available at any moment, ready to answer questions and point to which students need support and in specific areas. Instead of poring over endless spreadsheets, an executive dashboard might flag that “chronic absenteeism at School X has spiked 5 percent this month” or “fifth grade math proficiency is trending upward across the district.” This frees administrators to focus on response and strategy rather than number crunching. 
  • Timely, Actionable Data:  

In many districts, by the time a comprehensive report is compiled, the data is already weeks or months old. Leadership teams often find themselves making decisions based on historical snapshots rather than current conditions. Annual or periodic reporting cycles limit the ability to respond to emerging trends as they unfold. Shifting to timely, actionable data allows leaders to monitor progress continuously, act earlier, and guide strategy with greater confidence. 

In essence, AI-powered dashboards convert the data deluge into a wellspring of insight. They address the very gaps that educators complain about: making data interpretable, timely, and aligned to decision-making needs. For an executive team, this means far less guessing and far more knowing. It’s the difference between flying blinds and having a real-time data co-pilot. 

Real-Time Visibility Transforms Decision-Making 

Having data is one thing; being able to act on it at the moment is another. AI dashboards provide real-time visibility that fundamental changes in how district leaders make decisions – moving from reactive to proactive management. 

Consider the contrast. Before adopting AI powered dashboards, leadership teams relied on periodic scorecards and static reports to assess student performance. These processes were time intensive, often requiring months of preparation and limiting insight to backward looking summaries. Decision making was constrained by delayed visibility, making it difficult to respond while the school year was still in motion. 
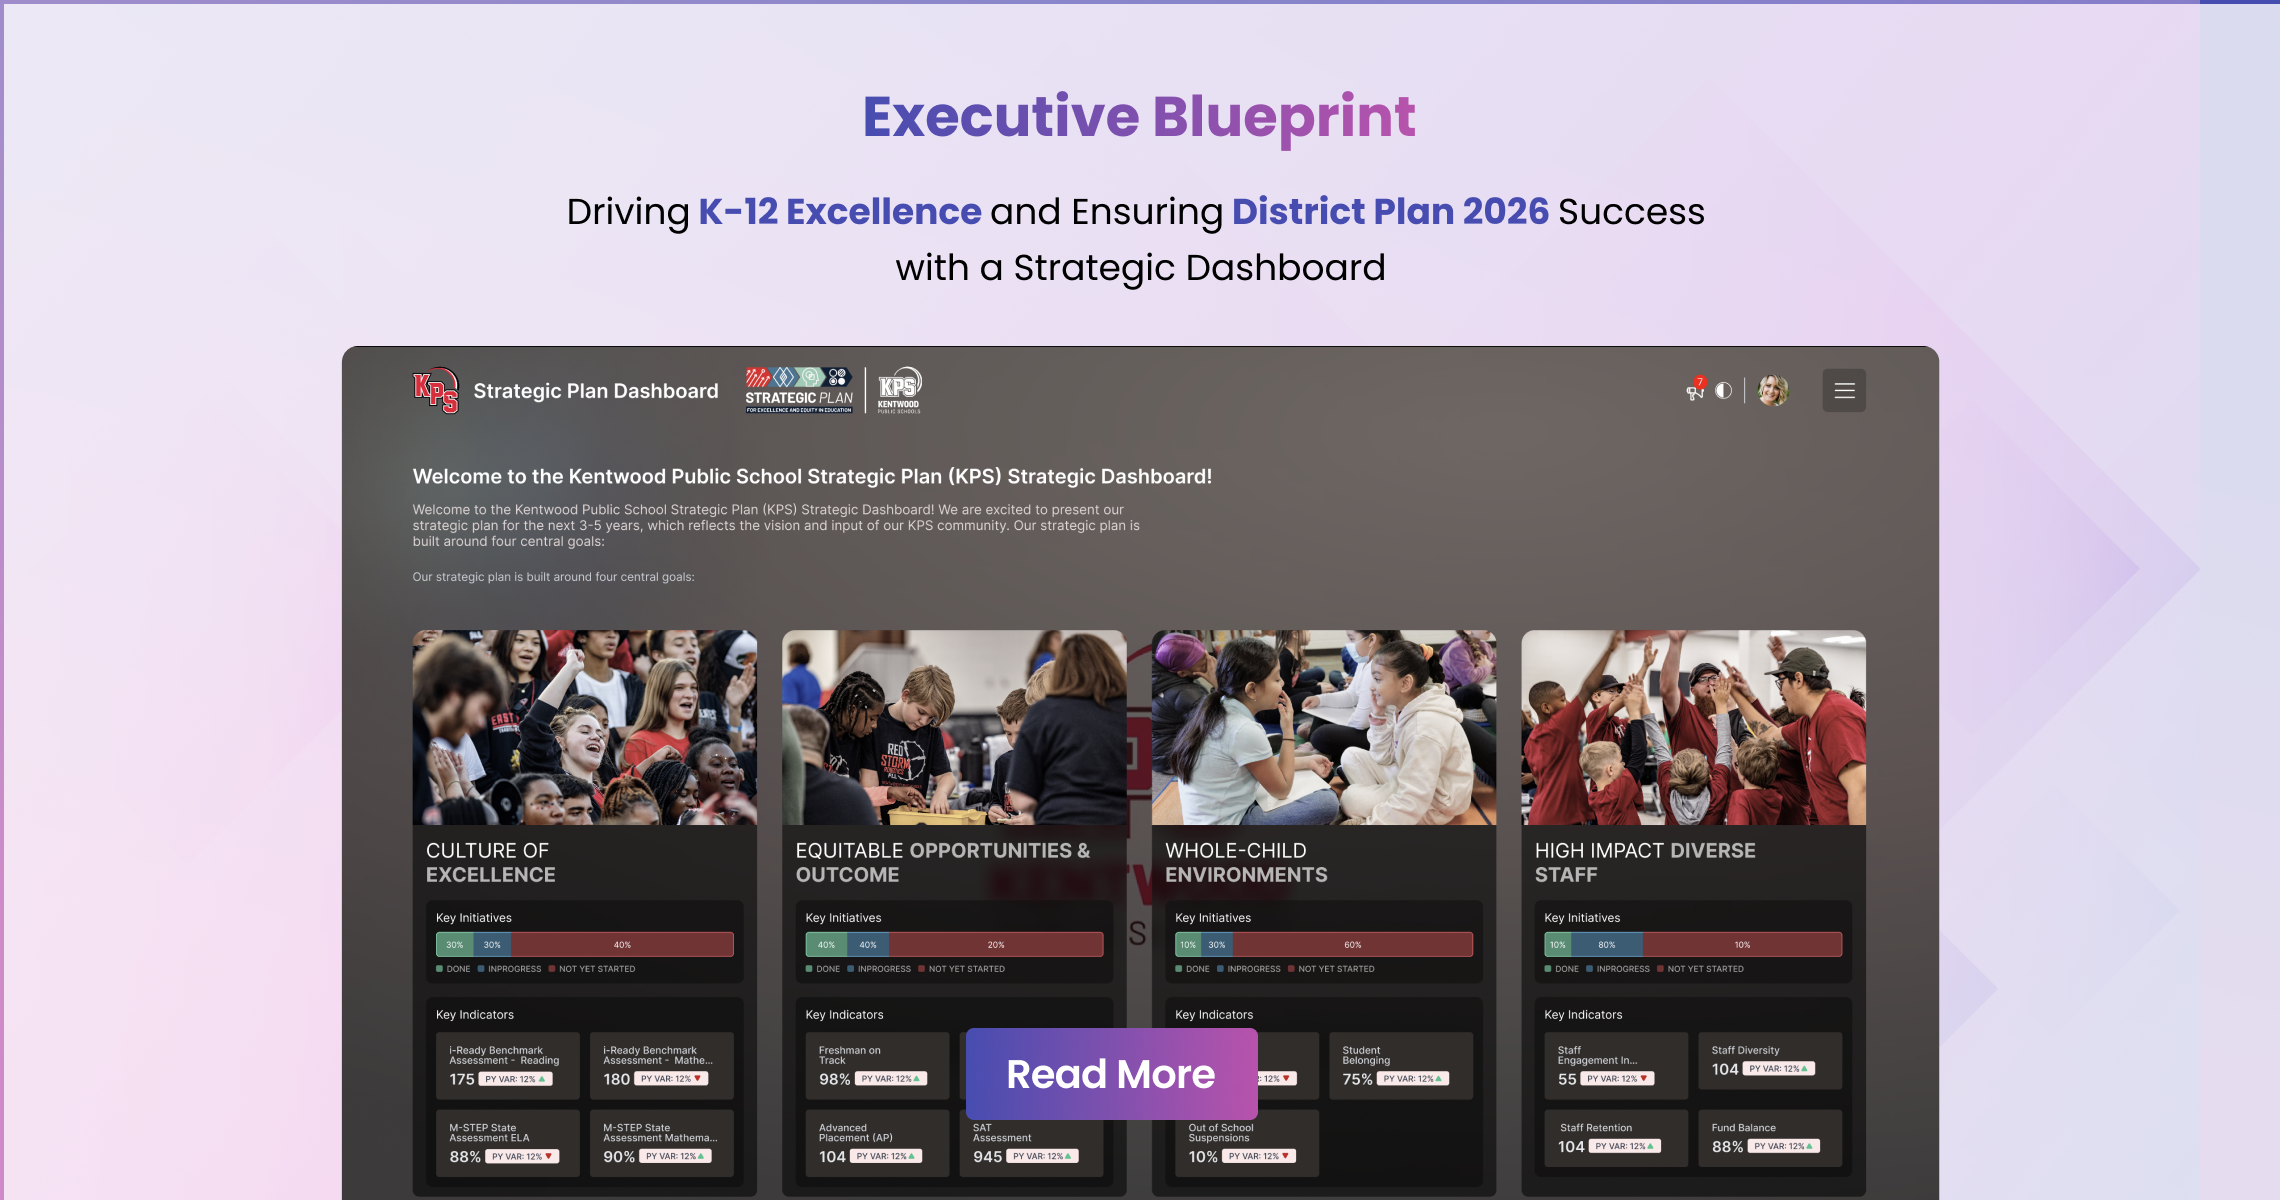
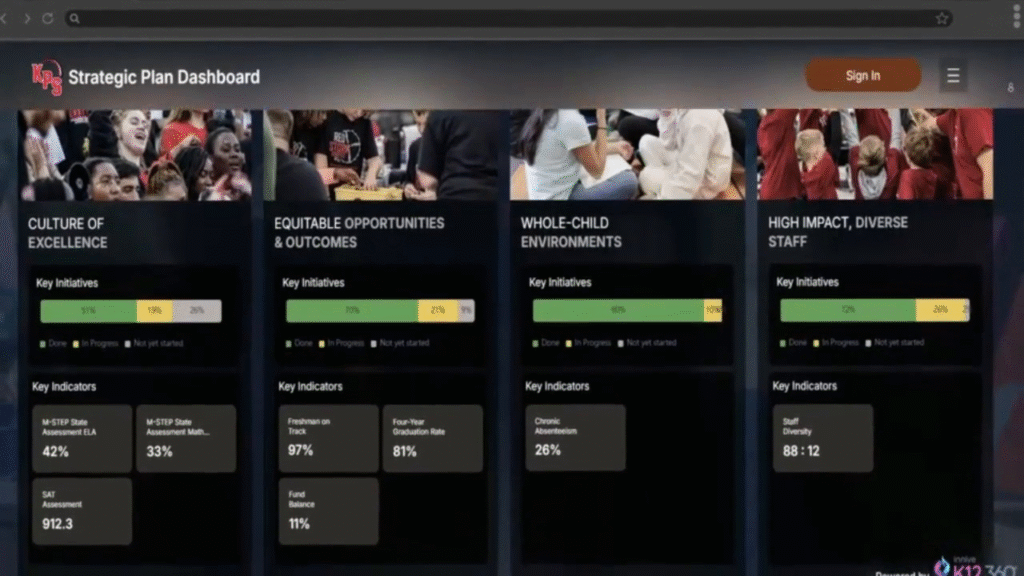
TodayKentwood Public Schools operates with near real time strategic dashboards designed for both internal leadership use and public transparency. District leaders can continuously monitor academic progress, staffing indicators, and operational signals across schools. Instead of waiting for end of year results, leadership teams can identify emerging gaps mid-year and adjust support, funding, or instructional strategies while it still matters. The shift has changed how decisions are made, moving from retrospective analysis to proactive action that directly supports students in the current school year. 

The benefits of real-time, AI-driven visibility include: 

  • Proactive Interventions: Dashboards with predictive analytics can alert leaders to emerging issues before they escalate. For example, an AI powered early warning system might automatically flag a pattern of declining math scores or rising absences for a particular student group weeks sooner than a human might notice. Research has shown that districts using early warning data systems often see meaningful improvements, including reductions in chronic absenteeism and lower course failure rates within a single year. These gains come from identifying risks early and responding while there is still time to change the outcome. With dashboards, a superintendent can receive an alert about a school’s attendance dip in time to deploy support that same month, not after the semester ends.  
  • Faster, Fact-Based Decisions: When all key metrics are available at a glance, leadership meetings become more about solutions and less about sifting through reports. Members of one district’s board of education noted that now with centralized, dynamic data, decisions that used to take a very long time can be made much more quickly and confidently. Instead of debating whose numbers are correct, the board and administrators see a shared dashboard updated with the latest data. This single version of the truth builds trust and streamlines decision making. As the board president put it, “Now that our data is centralized, we have an easier way to manage it and bring the public along with our decisions.” Transparency and speed go hand in hand. When stakeholders see the same facts, it is easier to reach consensus on actions. 
  • Operational Agility: AI dashboards aren’t just about academics; they improve operational oversight too. Transportation running behind schedule? The dashboard can flash an alert if on-time bus rates fall below a threshold. IT system down? The dashboard’s anomaly detection can notify the tech team immediately. In fact, CoSN’s survey shows security threat detection is the top AI use case in districts so far (cited by 65% of tech leaders) illustrating that AI dashboards can monitor infrastructure and safety data in real time as well. With these tools, a CTO or operations director gains a 24/7 command center of district functions. Issues that once might be discovered only after an audit or complaint can be seen and addressed as they unfold. 

Ultimately, real-time visibility through AI dashboards changes the leadership mindset from “What just happened?” to “What’s happening right now and what’s likely to happen next?” This shift from reactive to proactive management is invaluable. In the high-stakes environment of K-12 (where a delayed decision can mean students left without support, or resources misspent on a failing program), the ability to see and respond to data in the moment is a game-changer. It’s not about using tech for tech’s sake; it’s about empowering district leaders to do what they do best – lead – with the confidence that comes from up-to-the-minute intelligence. 

Strategic Planning Meets Live Data: Alignment and Accountability 

Every district has a strategic plan, but too often these plans live in binders or static PDFs that gather dust. AI-powered dashboards have the power to bring strategic plans to life, aligning day-to-day operations with long-term goals and making accountability a living, breathing part of district culture. 

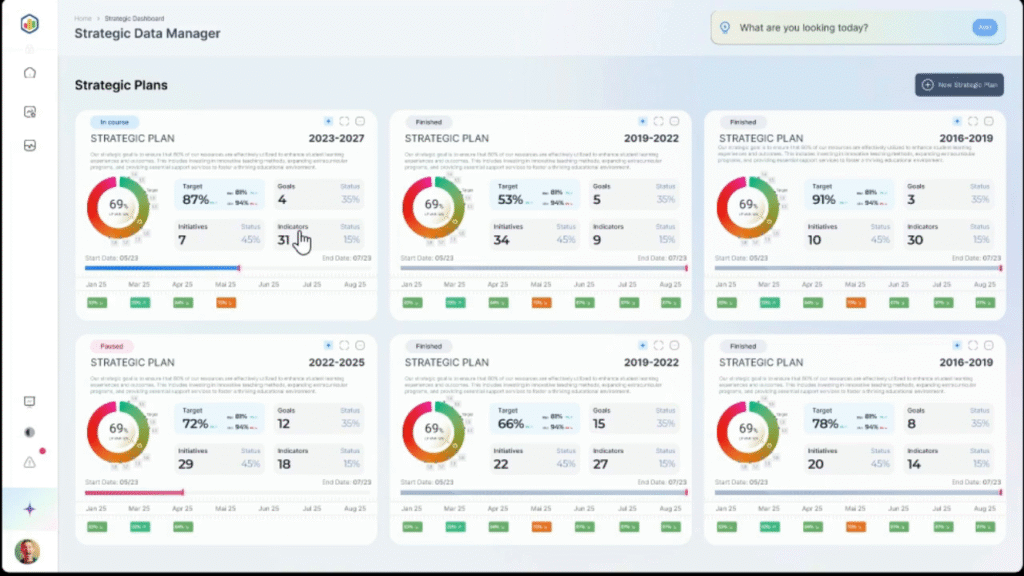
Take Kentwood Public Schools as an example. Rather than letting their multi-year strategic plan languish on a shelf, Kentwood’s leadership turned the strategic plan into an interactive dashboard that tracks progress in real time This means for each goal – whether it’s improving third grade reading proficiency or increasing family engagement – there are data indicators being monitored and displayed. The dashboard shows up-to-the-minute progress on key performance indicators (KPIs), so the superintendent and board can see exactly where things stand. It’s the difference between saying “we aim to improve X this year” and being able to pull up a screen that shows “we’re 60% of the way to our annual target for X, as of today.” This real-time tracking creates urgency and focus. Wins are visible and can be celebrated; areas off-track are flagged early for course correction. Kentwood’s move beyond static reports to a unified dashboard illustrates how aligning data with goals keeps leadership teams moving forward together toward the district’s vision.  

Keyways AI dashboards enhance strategic alignment and accountability include: 

  • Connecting Metrics to Mission: Every initiative or goal in the strategic plan can be associated metrics on the dashboard. For instance, if a goal is “improve STEM readiness,” the dashboard might display enrollment in advanced math/science courses, STEM test scores, and participation in STEM clubs. This ensures the strategic plan isn’t abstract – it’s continually measured. As one edtech leader described the dashboard builds dashboards directly from your plan so goals and outcomes stay seamlessly connected. When goals and data are linked, it keeps everyone honest about progress. 
  • Breaking Down Board Goals into Operational KPIs: Many school boards use balanced scorecards or annual targets. AI dashboards allow those high-level targets to cascade into department-level and school-level indicators that update automatically. For example, a board goal to “raise graduation rates by 5%” can be supported by a dashboard view of real-time credit accumulation, attendance, and course pass rates for the current senior class. This alignment means principals and district staff see how their work feeds the board’s objectives on an ongoing basis. It drives a culture where data becomes the common language of progress. 
  • Live Accountability and Course Correction: With continuous data, accountability is no longer a once-a-year report-out – it’s continuous. If a particular strategy isn’t yielding results by mid-year, that will be evident on the dashboard. Rather than waiting for disappointing end-of-year results, leaders can acknowledge the shortfall and pivot a new approach in time to still meet the goal. This adaptability is crucial. It also changes the tone of accountability; it’s less about pointing fingers after the fact and more about a shared commitment to adjusting and improving in real time. 
  • Visibility for All Stakeholders: Dashboards can be securely shared (with role-based views) so that every stakeholder, from board members to principals to teachers, and even parents, can see relevant data on progress. Similarly, a principal could share parts of the dashboard with their school’s parent-teacher organization to show, for instance, how school climate indicators are trending. When people can see the data for themselves, it builds a collective ownership of the district’s direction. No one feels kept in the dark. 

In summary, AI-powered dashboards serve as the bridge between lofty strategic plans and day-to-day execution. They ensure that goals aren’t just aspirations but actively managed targets, with data illuminating the path to success. For executives, this is gold: you get a direct line of sight from your high-level objectives down to the granular metrics, all in one place. The result is a district that’s not only data-driven but mission-driven, with everyone pulling in the same direction and seeing the evidence of progress (or the need for change) in real time. 

Conclusion: Leading with Intelligence in 2026 

In an era defined by rapid change and accountability, AI-powered dashboards have moved from “nice-to-have” to “must-have” for K-12 district leadership. They are the linchpin that allows superintendents, CTOs, and school boards to harness the full power of their data – converting it into timely intelligence, informed decisions, and aligned action. 

Picture the difference: A superintendent in 2023 might have made a critical budget decision based on last year’s test scores and a hunch about enrollment trends. A superintendent in 2026, equipped with an AI-driven dashboard, can make that same decision with live enrollment figures, current year test growth, real-time budget utilization, and predictive forecasts all on one screen. The decision that once felt like educated guesswork now feels like executing a well-informed strategy. This is the promise of AI dashboards – not to remove the human element from leadership, but to amplify it with sharper insight. 

By embracing AI-powered dashboards, districts gain: 

  • Real-time visibility into academics and operations, so they can respond to issues and opportunities as they arise, not after the fact. 
  • Predictive analytics that turn historical data into foresight, helping leaders intervene early and allocate resources where they will make the most impact. 
  • Strategic alignment of every level of the organization, ensuring that daily actions and outcomes are transparently connected to the district’s goals – fostering accountability and trust. 
  • Efficiency and focus, automating the grunt work of data processing so that human talent can focus on planning, problem-solving, and innovation. 
  • Confidence in decision-making, with facts to back proposals and changes. In an executive role, there’s no substitute for the assurance that you’re steering the ship using up-to-date, comprehensive information. 

Districts like Kentwood have shown what’s possible: turning static plans into living dashboards, and data chaos into clarity and community trust. They are early movers in what is fast becoming a national trend. As we head deeper into the AI age, every K-12 district will need to leverage these kinds of AI-driven insights to stay competitive and best serve their students. The urgency for 2026 is real – the tools are here, the data is plentiful, and the leadership vision is the last key ingredient. 

For U.S. school superintendents, CTOs, and board members reading this, the charge is clear: Now is the time to champion AI-powered dashboards in your district. Doing so will not only equip you to make better decisions and drive improvement; it will signal to your schools and community that your district is ready for the future – one where intelligent data use is at the heart of educational excellence. 

In 2026, data-rich leadership is smart leadership. AI dashboards are how you get there. The districts that act with urgency and purpose on this front will lead the pack in student success, operational agility, and stakeholder confidence. After all, when you can see farther and clearer, you can go farther – and that’s exactly what our schools and students deserve. 

About Strategic Plan 360, powered by Hexalytics. 

We help district leaders turn goals into measurable progress. Our dashboards unite academics, operations, finance, and HR in one clear view, enabling leaders to track goals, align resources, and build accountability. Grounded in clarity and transparency, our approach helps every team stay aligned and focused on meaningful outcomes for students. 

Ready to bring real clarity to your strategic plan. 
Connect with our team to see how an AI powered dashboard can support your district’s priorities and deliver leadership ready insight. 

The Smart Guide to Choosing the Right Data Solution for School District Progress

While every school district aims to lead with impact, systemic obstacles often make it harder to act with clarity and speed. Disconnected data, siloed systems, and limited visibility continue to challenge even the most strategic leaders. 

As expectations rise, district leaders must think differently about how data is used not just to report what has happened, but to shape what comes next. This guide explores the core challenges that hold districts back and the essential capabilities to look for when choosing solutions that truly move a district forward. 

Strategic Plans That Need Real-Time Insights

Districts invest significant time and resources into building strategic plans, yet many struggle to maintain visibility into how those plans are progressing. Without access to centralized, up-to-date data across departments, leaders rely on retrospective reports or anecdotal updates. This disconnect limits the ability to adjust strategies, communicate progress to stakeholders, and ensure misalignment between initiatives and measurable outcomes. 

To keep plans moving with purpose, districts need a clearer view that reflects progress as it unfolds. Strategic planning requires more than periodic reporting. Effective systems offer leaders a live view of progress, support needs, and how initiatives align over time. Solutions like Strategic plan dashboard that integrate data from across the district into a centralized planning framework to allow for more agile, data-anchored leadership. 

For a deeper look into how strategic dashboards can bring your district’s vision to life, explore our earlier blog: AI Powered Dashboards That Turn K-12 data into Real time Intelligence

Executive Insight That Moves Beyond Fragmented Systems

District executives must oversee diverse areas such as finance, human capital, student achievement, and operations. However, when each department operates with its own tools and metrics, a cohesive executive view becomes difficult to achieve. Leaders lose time reconciling information rather than acting on it. 

This is where integrated executive insight can bring a more complete leadership perspective. 

Leaders need more than departmental updates; they need integrated perspectives. Executive Dashboards that provide consolidated views, with the ability to move seamlessly between district-wide trends and school-level details, enable more precise interventions and smarter resource allocation. When information from finance, academics, HR, and operations converges into one interpretive layer, leaders are equipped to guide both strategy and execution.

Enrollment Data That Shifts from Lagging to Predictive

Enrollment is one of the most influential metrics for planning resources, staffing, and funding. Yet in many districts, enrollment data remains delayed, inconsistent, or scattered across platforms. Without a real-time understanding of patterns—by region, grade level, or demographic—leaders risk making short-term decisions that overlook long-term impact. 

A forward-looking enrollment view helps districts act with more confidence and precision. Understanding enrollment dynamics is essential for equitable staffing, funding, and community engagement. Tools like Enrollment Dashboard that allow for ongoing monitoring of enrollment patterns by geography, program, and student profile help districts shift from reactive adjustments to forward-focused planning. The ability to connect enrollment insights with staffing models, budget scenarios, and facility planning strengthens the district’s responsiveness and resilience. 

Asset Oversight That Moves from Disconnected to Unified

As technology and infrastructure investments grow across school districts, so does the challenge of managing them. Devices, curriculum materials, software, and transportation assets are often tracked through separate systems or not tracked at all. Without a unified view, teams struggle to maintain accuracy, complete audits, or ensure timely support. 

Bringing all asset data into one consistent framework can simplify this work significantly. Supporting every student and staff member means managing more than just devices. From digital tools and classroom equipment to transportation and instructional materials, Asset Fusion 360 combines asset tracking, service workflows, and integration with existing systems help districts optimize usage, streamline audits, and plan confidently. When data is aligned across systems and departments, resource management becomes proactive, not procedural.

Digital Access Gaps Turned Into Clear Equity Insights

Digital equity remains a key factor in student engagement and success, yet many districts lack a complete understanding of where access barriers exist. Broadband availability, device access, and funding data often live separately from student performance metrics, making it difficult to surface meaningful patterns. Connecting these access indicators to student outcomes brings much-needed clarity to equity decisions. 

Understanding the connection between digital access and student outcomes is critical to driving equitable improvement. Digital Access Dashboards integrates device access, funding data, and performance indicators offer leaders a clearer picture of where gaps exist and what impact they have. By exploring these metrics across schools, regions, and demographics, districts can identify patterns and allocate resources more strategically. The ability to link access to enrollment, attendance, and success transforms equity work from intention to action.

Student Readiness Viewed Through a Holistic Statewide Lens

Traditional dashboards often focus on test scores and graduation rates, leaving gaps in understanding the broader readiness of students for college, careers, and civic life. State education leaders need visibility into academics, well-being, engagement, and workforce pathways to fully support student success. 

A unified, whole-child view gives state leaders the insight needed to strengthen readiness efforts. Designed for state agencies, GPS dashboards that track whole-child outcomes provide the depth and clarity needed for meaningful decision-making. When key indicators are unified with AI insights and benchmarking, leaders can see trends clearly, improve transparency, and allocate resources effectively from one scalable platform.

Choosing Tools That Support Progress and Leadership Clarity

The most effective solutions are those that do more than display data; they bring context, cohesion, and clarity to decision-making at every level. Many districts still rely on tools that meet reporting requirements but fall short in supporting strategic leadership. Selecting systems that adapt to evolving priorities ensures long-term responsiveness and alignment. 

As district priorities evolve, here are the essential capabilities leaders should look for when selecting systems that support long-term growth and responsiveness. Real progress happens when leadership has the clarity to act, the systems to support collaboration, and the insight to align every decision with outcomes that matter. Choosing the right solution is about building the capacity to lead strategically, respond faster, and deliver meaningful progress for students, staff, and communities.

About Strategic Plan 360 by Hexalytics

We help district leaders turn goals into measurable progress. Our dashboards unite academics, operations, finance, and HR in one clear view, enabling leaders to track goals, align resources, and build accountability. Grounded in clarity and transparency, our approach helps every team stay aligned and focused on meaningful outcomes for students. 

Explore what your district could look like with connected insight. 
Schedule a demo today.

FAQs

1 How can we ensure the dashboards align with our district’s long-term goals?

Effective dashboards should mirror your strategic plan not just your data structure. That means aligning indicators with board goals, improvement plans, and community priorities from day one.

Yes. Modern dashboards allow you to connect data across instruction, operations, HR, and finance, giving leadership a more complete understanding of what drives performance system-wide.

It starts by replacing static reports with tools that update in real time and surface trends visually. When data reflects live progress, it becomes part of your leadership routine, not just your reporting calendar.

Look for more than software. Prioritize partners who offer customization, understand education deeply, and provide dedicated onboarding and long-term support.

Role-based dashboards ensure that each user superintendents, principals, board members see what’s most relevant to their work, without being overwhelmed by unnecessary data.

How Strategic Dashboards Strengthen Decision-Making for District Leaders

Introduction

District leaders navigate a steady stream of decisions every week, shaping instruction, guiding resources, supporting students, and advancing district priorities. Effective leadership depends on timely insight and a clear, unified view of what is happening across the system. 

Strategic dashboards provide that clarity. They offer superintendents, cabinet teams, and principals’ real-time visibility into district performance, ensuring decisions are grounded in insight rather than interpretation. When leaders can see emerging trends the moment they take shape, decision-making becomes more focused and aligned across the organization.  

This blog explores how dashboards support better decision-making across strategic planning, leadership transitions, equity, finance, and program effectiveness. 

Strategic Decisions That Shape District Performance

1.Strategic Planning & Execution 

Dashboards allow superintendents and District Teams to track the district’s progress against key strategic priorities like academic achievement, equity, and operational efficiency. With real-time views of KPIs, leaders can course-correct early and communicate progress clearly to boards and communities. 

2. Superintendent Transition Plans 

When new superintendents step in, a 100-day dashboard tracks key milestones, stakeholder engagement, and initiative launches. This not only ensures smooth leadership transitions but builds early credibility with the board and community. 

3. Equity Monitoring 

Equity dashboards break down achievement, discipline, and access metrics by demographics such as race, income, and program status. Leaders can pinpoint gaps and respond proactively, ensuring the district lives up to its promise of opportunity for all. 

4. Financial Visibility 

A finance dashboard tracks revenues, expenditures, fund balances, and capital projects. Business administrators and superintendents alike can use these insights for smarter budget allocation, forecasting, and board-level transparency. 

5. Program Effectiveness & ROI 

Dashboards help evaluate programs like summer school, tutoring, or teacher PD. With real-time feedback on participation, outcomes, and costs, leaders can identify what works and scale what matters.

Supporting Every Role, From the Cabinet to the Classroom

Superintendent & Cabinet 

Gain a high-level, real-time overview of district health, strategic goal progress, and resource effectiveness. Use scenario modeling to prepare for enrollment shifts or funding changes. 

Principals 

Compare their school’s performance with peer schools, target academic or behavioral interventions, and align site plans with district priorities. 

Teachers & Staff 

Track student-level progress across academics, attendance, SEL, and MTSS tiers. Use dashboards to support collaboration with counselors and administrators. 

Board of Education 

View evidence-based progress updates, validate budget decisions, and communicate district performance to the public. 

Families & Community 

Access public-facing dashboards showing clear goals, progress, and outcomes. These builds trust and keep the community informed.

Real-Time Data Driven Decisions

Administrators rely on dashboards to gain real-time insights into academics, behavior, attendance, and social-emotional learning. This immediate visibility helps leaders identify concerns early and adjust strategies before small issues become districtwide challenges. 

Rather than waiting for monthly reports, superintendents see trends as they emerge by supporting faster, more responsive decision making. 

Unified Educational Practices Across the System 

Dashboards help unify instructional practice by aligning classroom instruction, assessments, curriculum expectations, and state standards. Teachers, principals, and district teams see the same truth at the same time. 

Monitor and Measure Success with Precision 

Strategic dashboards allow districts to track growth at the district, school, classroom, and student levels. Leaders see: 

  • Which initiatives are improving outcomes 
  • How student groups are progressing 
  • Whether attendance strategies are working 
  • Whether investments are producing the expected return 

This continuous measurement ensures that decisions stay tied to results—not assumptions.

Key Benefits for School Administrators

Improved Decision Making 

Real-time data reveals sudden shifts in performance or attendance, enabling quick interventions. 

Operational Efficiency 

Dashboards automate reporting and reduce manual analysis. For example, state reporting becomes faster and less labor-intensive. 

Enhanced Student Outcomes 

By highlighting areas where students struggle, dashboards help leaders target interventions and improve learning outcomes. 

Administrator-Friendly Insight 

Leader dashboards provide a broad, strategic view, not just classroom-level data supporting districtwide planning and forecasting. 

These advantages reshape how superintendents and district teams lead every day.

Clarity Is the New Leadership Advantage

Superintendents and district teams lead better when they can see the whole picture. Strategic dashboards give them the real-time visibility needed to strengthen instruction, manage resources, communicate transparently, and align the entire system to student success. 

You can also read our related article on why K-12 school districts need a strategic plan dashboard to build a deeper understanding of the value behind these insights. 

Want to give your leadership team a clearer, smarter way to run the district? 
Explore Strategic Plan 360 by Hexalyticsa complete, real-time dashboard suite that unifies goals, measures progress and strengthens executive decision making.

About Strategic Plan 360, powered by Hexalytics.

We help district leaders turn goals into measurable progress. Our dashboards unite academics, operations, finance, and HR in one clear view, enabling leaders to track goals, align resources, and build accountability. Grounded in clarity and transparency, our approach helps every team stay aligned and focused on meaningful outcomes for students. 

Frequently Asked Questions

1. How can leaders identify issues early instead of discovering them too late?

Early-warning indicators help leaders spot patterns such as chronic absenteeism, budget variances, or performance drops before they become systemwide challenges.

Automated, real-time views remove the need for manual reporting and repeated data pulls, allowing leaders to focus on strategy rather than data assembly.

Leaders need real-time data instead of monthly or quarterly reports. Timely insight allows districts to respond before issues escalate and keeps decisions aligned with current conditions.

Because most districts use multiple systems like SIS, HR, finance, LMS, assessments each holding only part of the story. This creates gaps, delays, and inconsistent interpretations when leaders try to make decisions.

Most teams rely on manual spreadsheets. A connected, role-specific view helps principals and teachers quickly understand trends, student progress, and school needs.

AI Powered Dashboards That Turn K12 Data into Real Time Intelligence

Districts are sitting on more data than ever attendance trends, engagement signals, assessments, staffing patterns, financial indicators, school climate inputs. 
But somehow, more data has not led to more clarity. 

Leaders across the country are feeling the same pressure. 

  • 72% of district leaders say their data is scattered across too many systems (CoSN, 2024). 
  • 43% of superintendents report they cannot see real-time shifts in attendance, staffing, or interventions (Ed Week Research Center, 2024). 
  • And only 14% of districts have a platform that connects SIS, LMS, HR, finance, and operations into one coherent view. 

This is the reality shaping 2026.  And it’s exactly why AI-powered dashboards are moving to the center of K–12 leadership. Because today’s leaders no longer need more dashboards. They need intelligence to see what’s changing, understand why it matters, and act before the impact reaches students, staff, or budgets. To explore how AI dashboards evolve from real-time visibility into deeper strategic intelligence, see our related blog on AI-Powered Strategic Plans: From Static Goals to Predictive Dashboards 

Why Predictive Analytics Matters in K12 Education

The good news is that artificial intelligence can help districts transform data overload into actionable intelligence. Predictive analytics powered by machine learning is already being used in education to:  

Identify at‑risk students by analyzing patterns in attendance, grades and discipline records. Early detection allows educators to intervene before problems become crises. 

 Forecast resource needs by surfacing learning gaps and staffing requirements. This helps leaders allocate teachers, funding, and materials more effectively.  

Personalize learning by pinpointing each student’s strengths and needs and tailoring instruction accordingly  

Analyze retention and enrollment trends. Districts can examine where families drop off in the admissions process and understand factors driving withdrawals and transfers  

Evaluate financial aid by tracking how aid packages influence enrollment, spotting early signs of financial stress and comparing outcomes for students with and without aid  

Adoption of AI is accelerating. A recent DATIA K 12 report found that nearly 75 % of educators use AI for instruction or administration. Predictive analytics, while still emerging, is poised to become a cornerstone of data‑informed decision‑making.  

As districts push for stronger alignment between goals, resources and student outcomes, leaders need a clearer, more coherent view of their system. Our dashboard solutions bring essential indicators together in one environment, giving decision makers the insight required to act with precision and anticipate what comes next.

Unified Dashboards That Drive Insight

Enrollment dashboards provide a real-time understanding of student movement, retention patterns and future staffing implications, allowing leaders to plan with greater accuracy and stability. 

Digital access dashboards surface disparities in devices, connectivity and learning tools, helping districts address gaps that directly influence instructional quality and student readiness. 

Portfolio management dashboards present a balanced view of program performance, participation and resource investment, enabling leaders to evaluate impact and guide improvement with evidence rather than assumptions. 

Leadership portals deliver role-specific visibility for superintendents, cabinet teams and principals, consolidating academic, operational and student support metrics into a focused decision-making view. 

Statewide GPS dashboards built for state level analytics for consistent insight across districts, strengthening accountability, transparency, and statewide strategic planning. 

These examples represent only a portion of the solutions within our platform. The broader suite provides districts with a comprehensive analytical foundation one that supports continuous improvement, sharper decisions, and a more disciplined approach to strategic execution.  

Hexalytics brings additional capabilities behind the scenes. The company’s AI‑augmented engine provides semantic‑as‑a‑service, which intelligently identifies and optimizes an organization’s data. Their platform supports augmented, predictive, and prescriptive analytics, natural language processing, and chatbots.  

We work with district leaders to build personalized dashboards and data‑driven reports as well as data engineering services that modernize data architecture and centralize information. Together, these capabilities ensure that our solutions deliver not just charts, but trusted insights and sustainable data practices.

Clean, Structured Data: The Fuel for Effective AI

AI is not magic. It cannot fix missing or mislabeled data; instead, it amplifies whatever is fed into it. Clean, well‑organized data is essential for useful predictive analytic When information is messy or spread across incompatible systems, algorithms may produce confusing or biased result 

Data quality matters because of interoperability, the ability of systems to share data in a standardized and meaningful way Without interoperability, districts risk duplicate records, incomplete profiles and a lack of real‑time information, making meaningful analysis nearly impossible  

Business leaders echo this sentiment. A Forbes Technology Council article reminds us that “AI needs data more than data needs AI”  

AI is only as good as the data foundation beneath it. Rather than chasing every new algorithm, organizations should invest in robust data management and quality control. Hexalytics’ emphasis on data engineering and back‑office modernization helps districts build trust in the data that fuels their AI models. Source: forbes.com.

Addressing Educator Concerns and Promoting Ethical AI

Not everyone is enthusiastic about AI in schools. A recent Pew Research Center survey found that 25 % of public-school teachers believe AI tools cause more harm than good in K 12 education, while 32 % think the benefits and harms are about equal These reservations often stem from very real concerns  

Data privacy and student safety — who has access to data and how it is protected 

Academic integrity — fears that students may misuse AI to bypass learning 

Ethical implications — questions about bias and the fairness of AI‑driven recommendations  

These concerns highlight the need for ethical leadership and transparent safeguards. Organizations such as the International Society for Technology in Education (ISTE) offer professional development resources to help teachers frame AI as a support tool rather than a threat Harvard’s Center for Digital Thriving provides resources to navigate the ethical grey areas of AI use  

At the same time, AI can actually enhance privacy and security when properly configured. Machine learning models can flag unusual login patterns, anonymize data for analysis and monitor data flow to catch potential breaches to ensure these benefits outweigh the risks, school leaders should ask vendors hard questions: What are their data protection policies? How do algorithms use and store information? What protocols exist for consent, access and deletion? How can families and educators be included in the conversation  

Our dashboards integrate seamlessly with existing district systems, and Hexalytics’ commitment to strong data governance makes it easier for leaders to meet these requirements. 

Responsible AI Is About Leadership, Not Avoidance

Avoiding AI will not protect students; instead, it may widen gaps as other districts embrace technology responsibly. The best way to safeguard student data is to set clear boundaries, strong safeguards, and a commitment to ethics. Predictive analytics can empower educators to support students sooner, allocate resources more wisely, and tell a clearer story to their communities.  

District leaders interested in seeing this transformation should explore our platform Strategic Plan 360. In just a short session you can see how a live dashboard turns goals into measurable progress When data is trusted and analytics are predictive, schools move from being data rich to being data ready, and every decision has the power to move students forward.

Conclusion

Predictive analytics is no longer a future concept in K12 leadership. It is becoming a practical way for districts to respond to enrollment change, manage staffing with more accuracy, and identify student needs before they become barriers. But the real impact happens when these insights live in one place, stay connected to district goals, and remain visible every day. 

Our NexGen dashboards help you understand the signals that support timely action, and a unified data foundation that strengthens every decision. Districts that embrace predictive analytics and responsible AI are not just managing change. They are shaping it.

About Strategic Plan 360, powered by Hexalytics.

We help district leaders turn goals into measurable progress. Our dashboards unite academics, operations, finance, and HR in one clear view, enabling leaders to track goals, align resources, and build accountability. Grounded in clarity and transparency, our approach helps every team stay aligned and focused on meaningful outcomes for students. 

Build the AI powered data foundation your district needs. 

Connect with us to see how Strategic Plan 360 supports timely decision making. 

FAQ’s

1. What makes predictive analytics valuable for school districts?

Predictive analytics help leaders spot early patterns in attendance, enrollment, student performance, and resource demand. This allows districts to act before issues escalate and to plan with more accuracy.

Yes. It connects with student information systems, HR, finance, assessment platforms, and other district tools. This reduces manual work and creates a unified view of district data.

Strategic Plan 360 and Hexalytics emphasize data governance, privacy controls, and transparent reporting. The system supports district policies around consent, access, and secure data management.

The platform creates board-ready reports in minutes. These visuals make it easier to communicate progress, share results, and build trust with stakeholders.

Yes. Districts can tailor goals, KPIs, state reporting elements, and performance indicators to match local priorities and future needs.

Must-Have Metrics for Every K-12 Strategic Plan Dashboard

When district goals are clear, but results feel scattered, a strategic dashboard becomes the tool that brings everything and everyone together. As districts increasingly shift from fragmented reporting to unified, real-time dashboards, one question consistently comes up: What should we actually include in our strategic dashboard? 

If you’re just beginning your dashboard journey, or refining an existing one, this guide breaks down the essential elements that turn static data into strategic insight. 

And if you’re still exploring why a dashboard matters, you might find this earlier perspective helpful: Why Does K12 School District Need a Strategic PlanDashboard? It highlights the urgent need for real-time visibility, transparency, and alignment across departments.

Internal Strategic Dashboard: Aligning Goals, Initiatives, and Performance 

What if you could see exactly how every district initiative is performing—right now, in one place?

This internal strategic dashboard gives district leaders a powerful way to connect goals with real-time performance. Every goal is clearly defined and aligned with its supporting initiatives, each tied to measurable key performance indicators that track progress at every stage. 

You can instantly see where things stand, dive deeper into goal-specific insights, and explore the data by school, student group, or demographics. With AI-generated insights, a contribution matrix, and cause and effect analysis, the dashboard uncovers what is moving the needle and what needs attention. 

From tracking initiatives to evaluating impact, Internal Strategic Dashboard by Strategic Plan 360 helps leaders stay ahead, respond early, and keep everyone aligned toward district-wide success. 

Explore the Internal Strategic Dashboard

External Strategic Dashboard: Turning Plans into Visible Progress

A strategic plan is most effective when it’s active, visible, and driving decisions every day. 

This external strategic dashboard makes your district’s goals visible and actionable. Each goal is linked with specific initiatives, and every initiative includes key performance indicators that show exactly how progress is unfolding. 

Track performance in real time, monitor detailed metrics, and make confident decisions based on the most current data. The dashboard simplifies complex plans into clear, shareable insights—empowering leadership teams, board members, and communities to stay informed and aligned. 

Strategic Plan 360, powered by Hexalytics brings your vision to life and ensures that progress is not only made, but seen. 

See the External Dashboard Experience

Strategic Plan Data Manager: From Setup to Strategy in Seconds

Strategic planning often feels like a heavy lift for district teams—manual steps, scattered systems, unclear ownership, and delayed insights. Strategic Plan 360, powered by Hexalytics, changes that. 

This built-in data manager helps districts streamline the entire planning process—from setting goals to tracking performance—faster and smarter than ever. With AI-driven tools, you can instantly generate complete plans, build measurable goals, and add key performance indicators without starting from scratch. 

Creating a new plan is as easy as clicking “create new.” Add your structure, timeline, and team members, or use a previous plan as your template. AI helps accelerate every step—from writing structured goals to suggesting initiatives and indicators aligned to district priorities. 

Need flexibility? You can easily edit goals, adjust timelines, and assign responsibilities on the fly. You can even pull in live data from your existing systems to reduce manual work and keep everything in sync. 

With Strategic Plan 360, districts save time, reduce complexity, and keep their plans moving forward. 

Watch the Data Manager with AI in Action

From Vision to Measurable Results

In today’s complex education landscape, leading a school district requires more than setting goals; it demands real-time insight, alignment, and accountability. Strategic Plan 360, powered by Hexalytics, delivers exactly that. 

By integrating your district’s strategic plan with live performance data, AI-powered planning tools, and intuitive dashboards, it transforms static planning into dynamic execution. Whether you’re launching a new initiative or tracking long-term progress, Strategic Plan 360 gives leadership teams the clarity to make confident decisions and the tools to move forward with purpose. 

It’s not just about having a plan. It’s about making it work every day, across every school, for every student. 

About Strategic Plan 360

Strategic Plan 360, powered by Hexalytics, is an end-to-end strategic planning and performance management platform built for today’s K-12 school districts. It empowers leadership teams to define their goals, align initiatives, monitor key metrics, and communicate progress—all in one place. 

1. What’s the difference between an internal and a public-facing strategic dashboard?

Internal dashboards are role-based tools designed for superintendents, cabinet members, and principals to monitor real-time progress on district priorities. 
Public-facing dashboards communicate strategic goals and performance transparently to school boards, families, and the wider community.

Internal dashboards drive alignment, accountability, and fast decision-making. Public-facing dashboards build trust, promote transparency, and keep stakeholders engaged in the district’s mission.

Internal dashboards display detailed, real-time data for KPIs across academics, staffing, finances, attendance, and operations filtered by school, program, or student group. 

Simplicity and clarity. Public dashboards should showcase high-level goals, measurable outcomes, and progress updates by using plain language and intuitive visuals.

Yes. Role-based access allows districts to tailor visibility, ensuring internal dashboards remain secure, while public dashboards share the right level of information externally.

Let’s Move Your Plan Forward

You’ve defined your goals. Now let’s bring them to life. 
Book a personalized demo of Strategic Plan 360 and see how it can help your district align strategy with execution seamlessly.