Why Data-Driven Decision-Making Is Transforming K-12 Leadership

As districts prepare for the 2025–26 school year, the focus on educational technology is shifting from access to effectiveness.

The question is no longer Are we using technology well? but Is it helping students learn and teachers teach better?

District leaders are balancing the need to improve outcomes, support teachers, and manage tight budgets while identifying which tools truly deliver results. The challenge is not the amount of data available but understanding which evidence actually reflects improvement.

This blog explores how districts can move beyond surface-level metrics to uncover meaningful insights. It looks at the kind of data that helps districts see what truly improves learning and how solutions of Strategic Plan 360 support leaders in reading that evidence, aligning goals with results, and making clear, informed decisions.

Balanced Insight for Complete Progress

Success in education cannot be defined by test scores or budgets alone. Districts need a broader view that reflects performance, engagement, and growth.

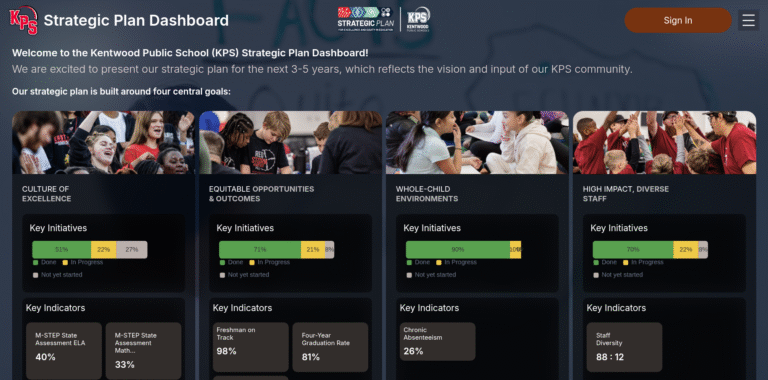
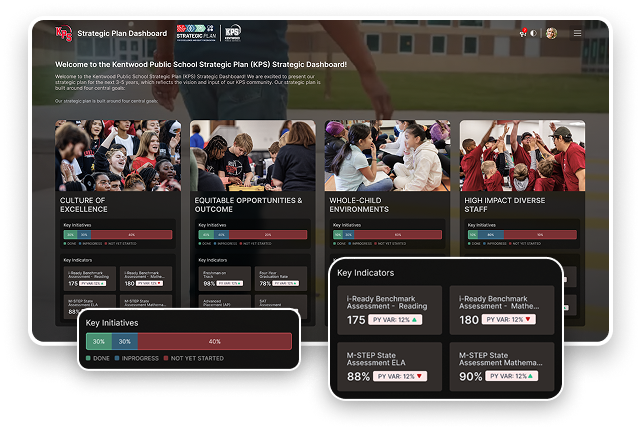
The Balanced Scorecard framework within the Strategic Plan Dashboard offers that balance by evaluating progress through four perspectives:

  • Student Success – Are students achieving academically and developing as whole learners?
  • Operational Efficiency – Are instructional and administrative systems working effectively?
  • Professional Learning and Growth – Are educators supported, developing, and empowered to lead improvement?
  • Financial Stewardship – Are resources being allocated and used responsibly to sustain long-term success?

Infographic 3 (2)

When these perspectives come together, the dashboard provides a well-rounded understanding of where a district stands today and how ready it is for tomorrow.

Student Performance That Reflects Real Growth

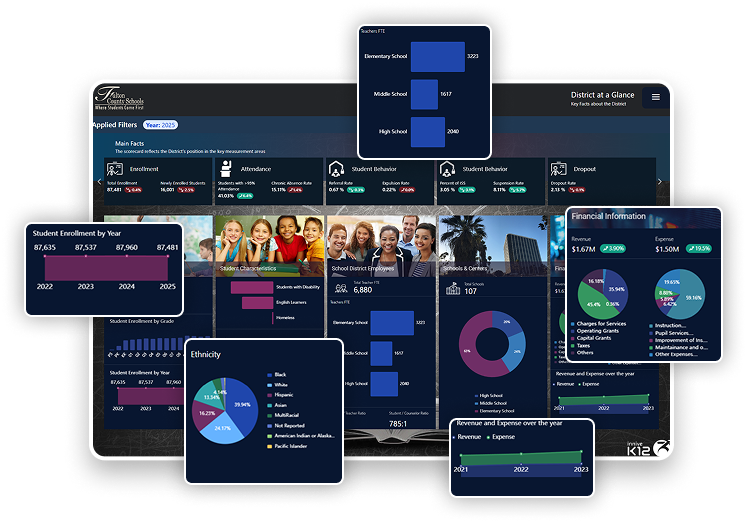
Student performance is more than test results or charts. The Strategic Plan Dashboard helps leaders connect classroom instruction with learning outcomes, showing how progress truly develops over time.

It reveals achievement patterns, highlights subject-level strengths, and identifies where extra support can make a difference. By linking performance, growth metrics, and graduation readiness, it helps districts see how every student is progressing toward long-term success.

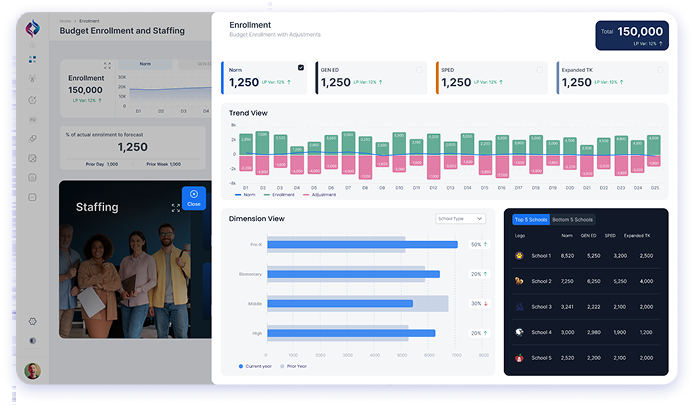
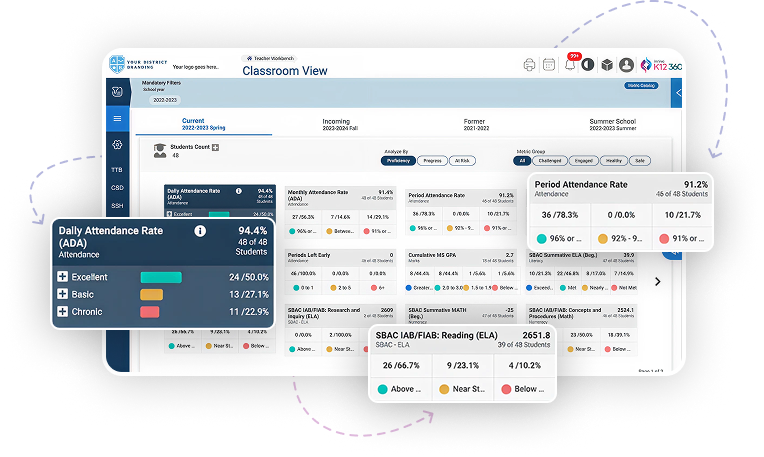
Seeing Attendance as Opportunity

Every day of learning matters. From daily participation to chronic absenteeism, the Strategic Plan Dashboard makes attendance visible and actionable.

By combining behavioral trends, early alerts, and social-emotional indicators, it helps leaders identify students who may need additional support.
This proactive view enables schools to act quickly and ensure that attendance data becomes a tool for growth and equity rather than a measure of compliance.

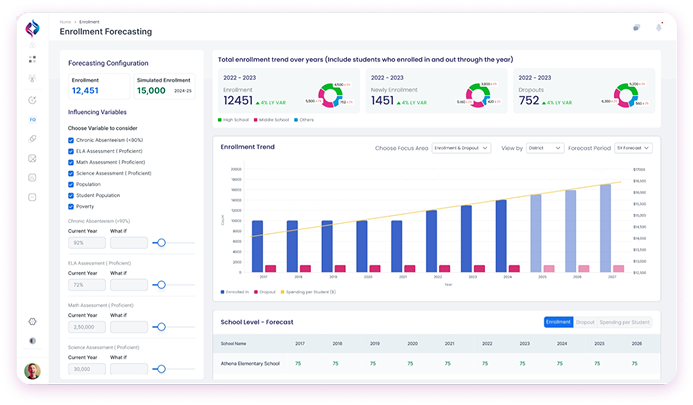
When districts use this kind of connected insight, they move from simply tracking activity to understanding learning. It’s not more data; it’s the right kind of data—evidence that links engagement, growth, and instructional impact in one view.

Instagram 1200x 1200

The Next Era of District Success

Districts are making tougher choices about what to keep and what to change. With tighter budgets and higher expectations, the focus is on tools that truly improve learning.

The new standard is simple: impact over presence. Leaders are asking how technology is used, what evidence supports it, and whether it advances real learning.

Strategic Plan 360 supports this shift by helping districts connect strategy with visible results. In 2025–26, success will belong to tools that work in practice, not just in theory.

Ready to see strategy come alive through data?
Talk with our Strategic Plan 360 team to explore how strategic plan dashboards turn district goals into visible, measurable results all in one unified platform.

Why District Leaders Are Prioritizing Dashboards

Every conversation about the future of education now includes one common theme: visibility.

Across districts, superintendents and leadership teams are turning to dashboards not just as data platforms, but as strategic engines for decision-making. When leaders can see progress in real time, alignment and accountability follow naturally.

It’s a shift powered by Strategic Plan 360—helping district leaders move from fragmented data to unified insight, where every metric tells a story of progress.

A Culture of Measurable Progress

Many school districts view dashboards not just as tools but as catalysts for continuous improvement. Instead of waiting for annual reports, leaders and teams can now track progress in real time that turns planning into an active, ongoing process.

When everyone works from the same data, alignment follows naturally. Principals stay focused on district goals, teachers see how classroom efforts connect to broader outcomes, and boards gain clear visibility into results. Dashboards make progress transparent, measurable, and collaborative—so success is seen, shared, and sustained at every level.

AI and Analytics as Leadership Tools

Modern dashboards now combine analytics and artificial intelligence to go beyond descriptive reporting. Predictive models help districts anticipate challenges before they surface, such as identifying early attendance risks or forecasting enrollment shifts.

Leaders are also using our AI-powered data managers to simplify complex processes, from setting measurable goals to importing performance indicators from multiple systems. These tools eliminate the manual effort of gathering data, allowing administrators to focus on strategy, equity, and results.

The outcome is more informed decision-making, better use of time, and a stronger alignment between district goals and day-to-day action.

Real-World Example: Kentwood Public Schools

Kentwood Public Schools offers a powerful example of what this approach looks like in action.
With a commitment to transparency and measurable growth, Kentwood launched Strategic Plan Dashboard that connects district goals directly to outcomes in literacy, college readiness, and whole child success.

The dashboard displays progress on key performance indicators, allowing leaders, staff, and the community to see exactly how the district’s strategic priorities are advancing. It serves as a dynamic reflection of Kentwood’s mission, where excellence and equity stay visible, measurable, and actionable

Behind the scenes, administrators use internal dashboards to monitor the same goals in greater detail. This dual structure, internal and external dashboards ensures that the district stays accountable while maintaining clarity across teams. The result is not only improved decision-making but also stronger trust between schools and the community.

Real-World Example: Kentwood Public Schools

In today’s environment, stakeholders expect openness and accountability. Dashboards fulfill that expectation by translating data into insights that speak to everyone

When families, staff, and board members can easily see district progress, communication becomes proactive instead of reactive. This transparency strengthens trust in district leadership and demonstrates that every decision is rooted in evidence.

Connecting Strategy, Operations, and Equity

Dashboards also help leaders connect strategy with execution. Budget decisions can be aligned with academic goals. Attendance data can inform staffing plans. Equity measures can be tracked side by side with achievement outcomes.

Instead of operating in silos, departments now share a single source of truth. This keeps goals, resources, and accountability focused on equitable student success.

Looking Ahead

As districts prepare for the next era of education, dashboards are becoming essential to sustainable leadership. They combine clarity with agility, two qualities every modern superintendent value.

The message is clear: visibility drives progress.

When data is unified, transparent, and accessible, every goal gain momentum. That is why district leaders are prioritizing dashboards—not as another system to manage, but as the platform that brings strategy to life.

Data tells the story. Strategic Plan 360 makes it visible.
Take a closer look at how your district can plan smarter, act faster, and show results.

Book a personalized demo with our team.

The New Command Center for District Leaders: Executive Dashboards in Action

In today’s fast-moving education environment, district leaders are expected to deliver clarity, transparency, and measurable impact—faster than ever before. Superintendents, boards, and executive teams no longer have the luxury of waiting weeks for static reports. Instead, they need a single place to see the whole picture of their district in real time.

That command center is here – The Executive Dashboard.

Why Executive Dashboards Are Rising Now

Across education and enterprise, dashboards are no longer a nice-to-have—they are becoming the new norm. The 2025 State of EdTech Leadership Survey by CoSN shows that 61% of district leaders now rank dashboards as a top technology investment for improving decision making and reporting.

The reason is simple. Today’s challenges such as enrollment declines, staffing pressures, ESSER funding cliffs, and digital equity demands cannot be solved by siloed systems or fragmented reports. District leaders need a 360° view that connects finance, HR, operations, instruction, and technology into one hub.

From Strategy to Executive Insight

Many district leaders are asking a tough question — Is our strategic plan really on track?

As district priorities expand, leaders need more than visibility, they need foresight. Unlike static reports, these dashboards bring everything together through data integration, predictive analytics, and AI-driven insights.

Executive Dashboard Insights - Infographic

The Executive Dashboard: One Hub, Many Views

Think of the Executive Dashboard as a cockpit. Just as pilots rely on one panel of instruments to guide a complex aircraft, leaders need one hub that brings all district priorities into focus.

With StrategicPlan360 powered by Hexalytics, Executive Dashboards are built to adapt to every role:

  • CFO Dashboards: Track budgets, expenditures, revenue streams, and forecast scenarios.
  • CIO Dashboards: Monitor technology adoption, cybersecurity, device refresh cycles, and network health.
  • HR Dashboards: Manage staffing levels, retention, and pipeline needs in real time.
  • Financial Dashboards: Provide transparent, board-ready insights into district finances.
  • KPI Dashboards: Align every initiative to strategic plan goals and measurable outcomes.
  • Marketing Dashboards: Understand community engagement, enrollment campaigns, and outreach impact.


Rather than juggling multiple reports, each leader sees the right information at the right time with the ability to drill down from districtwide KPIs to school-level insights in just a click.

A Real-World Example: Kentwood Public Schools 

Kentwood Public Schools, Michigan provides a strong example of what is possible. Like many districts across the country facing fluctuating enrollment, staffing constraints, and rising community expectations, Kentwood adopted the StrategicPlan360 Executive Dashboard.

Now district leaders can view enrollment trends, staffing ratios, financial outlooks, and academic progress in one clear place. When board members request progress updates, superintendents no longer wait weeks for custom reports. The data is available, visual, and actionable, leading to faster conversations and smarter decisions.


What Makes Today’s Dashboards Different

  • Drill Down and Roll Up Views
    Executives should be able to zoom out for a high-level overview or drill down to inspect performance at the school, grade, or program level. This layered view ensures strategic alignment while enabling informed resource allocation.
  • Benchmarking and Trend Analysis
    Comparisons across schools, regions, or student groups reveal not only performance gaps but also best practices and outliers. Dashboards that display historical trends help leadership identify patterns, anticipate challenges, and drive continuous improvement.
  • AI Powered Forecasting and Alerts
    AI enhanced dashboards can predict risks such as chronic absenteeism, staffing shortages, or budget pressures before they occur. Automated alerts shift leadership from reactive firefighting to proactive intervention.

The Takeaway

Executive Dashboards are becoming the new command center for district leadership. They deliver:

  • Clarity: One place to see finances, staffing, enrollment, and performance.
  • Speed: Real-time insights to support quick, confident decisions.
  • Trust: Transparent data that strengthens communication with boards and communities.
  • Impact: Progress on strategic goals that is visible and measurable.

As Kentwood Public Schools and many others are showing, the future of leadership is not about more reports. It’s about one hub that brings every signal together, guiding leaders from uncertainty to action.

Ready to see how data becomes direction?
Talk with our Strategic Plan 360 team to explore how dashboards turn district goals into visible, measurable results all in one unified platform.

How Can Leaders Turn Enrollment Data Into Actionable Strategy

Enrollment data is one of the most powerful indicators of a district’s future, shaping how schools plan, staff, and invest in their communities.

This blog explores how the Enrollment Dashboard transforms that complexity into clarity, giving districts a connected view of enrollment, capacity, and demographic trends in real time.

You’ll see how leaders are forecasting with precision, aligning resources strategically, and using spatial and demographic insights to guide smarter, faster decisions. It’s a closer look at how live enrollment intelligence is redefining the future of district planning.

Despite its importance, enrollment data rarely tells a complete picture until it’s connected, visualized, and understood in real time.

The Enrollment Dashboard changes that reality. It provides a connected view that turns data into direction and planning into precision.

Seeing the Complete Landscape

The Enrollment Dashboard presents a unified picture of student enrollment, building capacity, transfers, and demographic changes. District leaders can view live updates instead of waiting for static reports, allowing decisions that match the pace of their communities.

From new enrollments to projected population shifts, every element is designed to help leadership teams align planning, staffing, and funding with clarity and speed.

Why Enrollment Intelligence Matters

Enrollment data is more than a headcount. It defines instructional needs, staffing levels, transportation planning, and financial projections. When leaders have an accurate understanding of how their student population is changing, they can adapt strategies before challenges emerge.

The Enrollment Dashboard supports this proactive approach by helping leaders answer essential questions:

  • Where is growth accelerating?
  • Which campuses may soon exceed capacity?
  • How should resources be balanced to maintain equity and efficiency?

Turning Information into Strategic Direction

The Enrollment Dashboard focuses on the dimensions that matter most for planning and performance. Each feature is built to translate numbers into insights that drive forward-looking action.

Aligning Budget, Enrollment, and Staffing

Precise enrollment counts are essential for allocating teachers, counselors, and support staff. The dashboard connects daily updates on attendance and student movement with staffing levels, providing a reliable view of where adjustments may be required.


Forecasting with Confidence in the Future

By combining attendance patterns, assessment outcomes, and population data, the dashboard models potential future trends. This allows districts to explore various scenarios and prepare long-range staffing and facility plans supported by real projections.


Extracting Strategic and Business Insights

Historical enrollment and graduation data reveal powerful trends across multiple years. Leaders can explore shifts in student movement, analyze program participation, and use these insights to refine district strategy with evidence-based precision.

Understanding Enrollment Through Location

Enrollment is deeply geographic. The dashboard integrates spatial data to show where students live, how far they travel, and how demographics vary across communities. This spatial perspective enables leaders to design boundary plans and program outreach that meets local needs.


Key Features and Benefits

  • Real-Time Tracking
    Access live enrollment information across every campus and grade.
  • AI-Driven Forecasting
    Anticipate enrollment patterns and identify emerging risks through intelligent analytics.
  • Demographic Perspectives
    Explore student data by ethnicity, gender, and program participation to guide inclusive planning.
  • Program and Regional Analysis
    Examine conversion rates by ZIP code and uncover opportunities for community engagement.

The District Advantage

The Enrollment Dashboard creates a shared foundation for planning across departments.

  • Informed decisions: Leadership teams can respond to trends early and adjust plans efficiently.
  • Operational alignment: HR, finance, and facilities teams work from the same set of insights.
  • Equity-centered action: Demographic and regional data support fair distribution of opportunities and resources.

When everyone works from a common picture, planning becomes seamless, communication improves, and strategic outcomes become easier to achieve.

Building the Future of District Planning

Today’s educational landscape demands agility and foresight. The Enrollment Dashboard provides both, connecting every decision to the data that defines it. It equips district leaders to prepare, adapt, and guide their communities with clarity and intent.

It is not simply a reporting system. It is a foundation for smarter planning and sustainable growth.

Experience how live enrollment intelligence transforms district planning.
Request a Demo to see how your district can connect data, people, and strategy through one powerful platform.

AI-Powered Strategic Plans From Static Goals to Predictive Dashboards

Artificial intelligence is quickly becoming central to conversations about the future of K–12 education. As CoSN notes, for education leaders, the focus is on guiding AI integration responsibly and effectively.

By fostering dialogue, shaping strategies, and emphasizing responsible use, the focus is on how AI can enhance learning, promote equity, and expand accessibility that ensures schools are prepared for a future defined by these technologies.

That same shift is now reaching Strategic Plan dashboards.

Today’s dashboards are mostly static, showing what has already happened. Leaders set goals, track metrics, and revisit them quarterly or annually. By the time updates are shared, challenges may already have shifted.

The next wave, powered by AI, will act more like copilots for District leaders with conversational, adaptive, and proactive capabilities.

AI is changing that story. Today’s strategic dashboards are no longer just reporting progress; they’re predicting the future, surfacing insights before challenges grow, and highlighting opportunities leaders can act on in real time

Dashboards That Drive Direction

The Strategic Plan Dashboard brings every district goal to life. It turns complex data on performance, equity, and well-being into a clear, connected view of progress. From culture to outcomes, leaders can see where goals stand, track impact, and drive improvement in real time.

Artificial intelligence is quickly becoming central to conversations about the future of K–12 education. As CoSN notes, for education leaders, the focus is on guiding AI integration responsibly and effectively.

By fostering dialogue, shaping strategies, and emphasizing responsible use, the focus is on how AI can enhance learning, promote equity, and expand accessibility that ensures schools are prepared for a future defined by these technologies.

That same shift is now reaching Strategic Plan dashboards.

Today’s dashboards are mostly static, showing what has already happened. Leaders set goals, track metrics, and revisit them quarterly or annually. By the time updates are shared, challenges may already have shifted.

The next wave, powered by AI, will act more like copilots for District leaders with conversational, adaptive, and proactive capabilities.

AI is changing that story. Today’s strategic dashboards are no longer just reporting progress; they’re predicting the future, surfacing insights before challenges grow, and highlighting opportunities leaders can act on in real time

Dashboards That Drive Direction

The Strategic Plan Dashboard brings every district goal to life. It turns complex data on performance, equity, and well-being into a clear, connected view of progress. From culture to outcomes, leaders can see where goals stand, track impact, and drive improvement in real time.


Whole child dashboards can surface connections across academics, behavior, and well-being to direct support early.


Executive Dashboards give leaders a unified, real-time view of academics, finance, and operations. Powered by AI and predictive analytics, they turn data into foresight that drive strategic decisions


Enrollment dashboards can forecast changes by region or grade, guiding staffing and facilities planning.


Digital Access Dashboards can model scenarios, so leaders understand the impact of device availability, internet connectivity, and resource gaps before decisions are finalized.


This shift from reactive to proactive helps districts stay aligned even as needs evolve.

Predictive Dashboards as Strategic Partners

Predictive dashboards bring three major advancements to strategic planning:

Proactive Risk Detection
Rather than waiting for warning signs, dashboards review attendance, performance, budgets, and operations to identify risks before they emerge.

Dynamic Goal Alignment
As goals change, dashboards adjust. Key measures are updated in real time to reflect shifting conditions, ensuring leaders always see what matters most.

Actionable Recommendations
Dashboards act as active partners. They provide strategies, compare outcomes, and guide leaders toward faster and more confident decisions.

Personalized Insights for Every Leader 

No two leaders face the same challenges. Superintendents may focus on overall district progress, while principals zero in on building-level results. Finance officers care about resources; instructional leaders focus on student growth.

Every district, organization, or business unit has different priorities. AI-enabled dashboards learn user preferences, roles, and goals, delivering insights tailored to each leader.

The Strategic Plan Dashboard tailor’s insights to each role, making the information simple to access and meaningful to act on. This personalization builds trust, transparency, and confidence in every decision.

Envisioning the Next Generation

Looking ahead, Strategic Plan Dashboards will evolve even further:

  • Leaders will be able to ask complex questions in plain language and get clear, immediate answers.
  • Scenario planning will allow districts to model “what if” situations before setting strategy.
  • Visuals will become more interactive and intuitive, helping everyone from teachers to board members understand the story behind the numbers.

Strategic plans will no longer be annual documents. They’ll be living, adaptable guides that evolve with each new challenge and opportunity.

Why It Matters for District Leaders

As communities expect faster answers and greater transparency, district leaders need more than data, they need tools that guide action. Predictive dashboards ensure strategies stay relevant, progress is visible, and resources are aligned with student success.

The result is stronger trust, clearer communication, and a district that’s prepared not just for today but for tomorrow.

Final Takeaway

AI is transforming strategic planning from a reporting exercise into a proactive, predictive discipline. Dashboards are evolving into strategic partners that surface risks, illuminating opportunities, and guiding leaders toward better outcomes.

The future belongs to leaders who don’t just track goals but engage with living, AI-powered plans that adapt as fast as the world changes.

👉 Ready to see what predictive dashboards can do for your organization? Request Demo – strategicplan360

Where to Learn More

5 Ways Whole Child Analytics Helps You Prepare for Your Next Board Meeting

When the school board meets, district leaders are expected to bring clarity, transparency, and solutions to some of the toughest questions in education. From chronic absenteeism to student well-being, the pressure is on to provide clear evidence of progress and a plan for success.

Whole Child Analytics helps district leaders go beyond raw numbers to present a clear, actionable story. With role-based dashboards and strategic goal alignment, you’ll walk into your next board meeting ready to answer tough questions with confidence.

1. Align Student Data With Strategic District Goals

Board members want to know: Are we meeting the goals we set? Whole Child Analytics lets you map academic, behavioral, SEL, and attendance indicators directly to your district’s strategic plan. Instead of generic reports, you can show progress toward specific goals like improving graduation rates, reducing chronic absenteeism, or strengthening student belonging.

Tip: Use dashboards that align KPIs with board-approved goals to keep the conversation focused and transparent.

2. Use Role-Based Dashboards for Clearer Presentations

Superintendents, board members, principals, and counselors all need data—but not in the same way. Whole Child Analytics provides dashboards tailored to each role, so you can present the right level of detail for your audience.

Tip: When preparing for a board meeting, rely on superintendent-level dashboards that offer big-picture trends, while keeping school-level and subgroup detail in reserve for follow-up questions.

3. Answer Tough Questions About Student Success With Confidence

Questions about discipline disproportionality, chronic absenteeism, or declining test scores can be tough if you’re only looking at surface data. Whole Child Analytics integrates multiple data streams, so you can explain why trends are happening and what interventions are in place.

Tip: Pair student outcome data (test scores, attendance) with whole child insights (behavior, SEL, demographic data) to show root causes and responsive action.

4. Show the Impact of Interventions Over Time

Boards want to see more than plans—they want proof. Whole Child Analytics tracks interventions across MTSS, SEL initiatives, or attendance programs so you can demonstrate whether strategies are working.

Tip: Highlight year-over-year or semester-over-semester changes tied to specific initiatives to show impact with evidence.

5. Build Trust With Your Board and Community Through Transparency

When board members, families, and the community see clear, consistent reporting, confidence grows. Whole Child Analytics makes it easy to share data stories in ways that are accessible and actionable.

Tip: Use visuals from dashboards that highlight progress and challenges openly—demonstrating accountability while reinforcing your commitment to success for all students.

Whole Child Analytics for Student Success

Standardized test scores have long been the dominant metric for assessing student performance. But this narrow focus masks critical dimensions of student experience—like social, emotional, behavioral, and attendance factors—that shape learning and achievement. Whole Child Analytics expands the lens, helping districts identify and close opportunity gaps by integrating behavioral, SEL, attendance, and demographic data—so every student has the chance to succeed.

1. Why Test Scores Alone Fall Short

Relying solely on test scores fails to account for root causes of achievement disparities. Without considering behavioral issues, chronic absenteeism, socio-emotional struggles, or systemic challenges, educators risk misinterpreting performance gaps and overlooking students in need.

2. What Is Whole Child Analytics in Education?

Whole Child Analytics combines multiple types of data:

  • Behavioral Data: Patterns in classroom behavior, disciplinary referrals, and engagement. Approaches like PBIS frame behavior through preventive, data-informed interventions that keep students in class and foster positive environments.
  • Social-Emotional Learning (SEL): Metrics on self-efficacy, empathy, belonging, stress, and connectedness. Research shows SEL enhances academic performance, attendance, engagement, and well-being. It also improves relationships, inclusion, and communication—key ingredients for ensuring success for all learners.
  • Attendance Data: Chronic absenteeism often signals underlying social-emotional, health, or safety issues. When integrated with other data, it enriches understanding of academic challenges.
  • Demographic Data: Analyzing patterns by race, socioeconomic status, and other demographics reveals where opportunity gaps exist and where support systems can be strengthened to help every student thrive.

3. How Integration Supports Student Success

When combined, these data points create a dynamic, holistic view:

  • Root Causes Emerge: Low test scores tied to chronic absences or stress signal different interventions than low test scores from content gaps.
  • Discipline Patterns Surface: Behavioral data plus demographics show who is most affected by punitive discipline—allowing schools to provide more supportive alternatives.
  • Belonging and Engagement Shine Through: SEL metrics help schools foster belonging, resilience, and connectedness, which in turn improve attendance, engagement, and academic outcomes.

This enriched picture empowers districts to direct resources where they matter most—so every student has the chance to reach their potential.

4. District Empowerment Through Whole Child Analytics

District leaders gain powerful tools to:

  • Track Goals for Student Success: Dashboards showing behavioral, SEL, attendance, and demographic intersections highlight where opportunity gaps exist and whether they’re closing.
  • Align Resources Strategically: Localized data enables better deployment of counselors, SEL programming, behavioral supports, and instructional strategies.
  • Engage Stakeholders Transparently: Sharing a whole child view of student needs with educators, families, and community partners builds trust and shared responsibility.
  • Monitor Progress Over Time: Data helps leaders see whether interventions are improving outcomes—for example, reductions in chronic absenteeism after SEL or PBIS rollout.

Test scores only tell part of the story. Whole Child Analytics—including behavioral, SEL, attendance, and demographic data offers a full picture of student readiness and well-being. By taking this holistic approach, districts create the conditions for success for all students, ensuring that every learner has the support they need to thrive.

Want to see how this works in practice? Schedule a demo Request Demo – strategicplan360