Why K12 Districts Need a Strategic Plan Dashboard in 2026

America’s public-school districts are navigating a turbulent moment. With declining enrollment, shrinking budgets, and increasing demands for equity, transparency, and student support, traditional strategic plans are no longer enough. A growing number of districts are turning to advanced AI powered Strategic Plan Dashboards to keep pace. 

This blog explains why modern K12 leadership now depends on Strategic Plan Dashboards and how districts can use real time data to navigate enrollment shifts, staffing challenges, equity expectations, and transparency needs. 

Here is why, especially in 2026, a dashboard is not just helpful but essential. 

Declining Enrollment and Funding Pressure

After years of reliance on stimulus funds, many districts now face falling enrollment and tight budgets. According to recent data from K12 Dive https://www.k12dive.com and 2erstrategies.org https://www.2erstrategies.org, public school enrollment is declining in many regions. This places pressure on funding stability and forces leaders to make difficult decisions. 

This trend creates a domino effect. Fewer students lead to reduced state and federal funding. Reduced funding limits the ability to invest in programs, staff, and essential student services. 

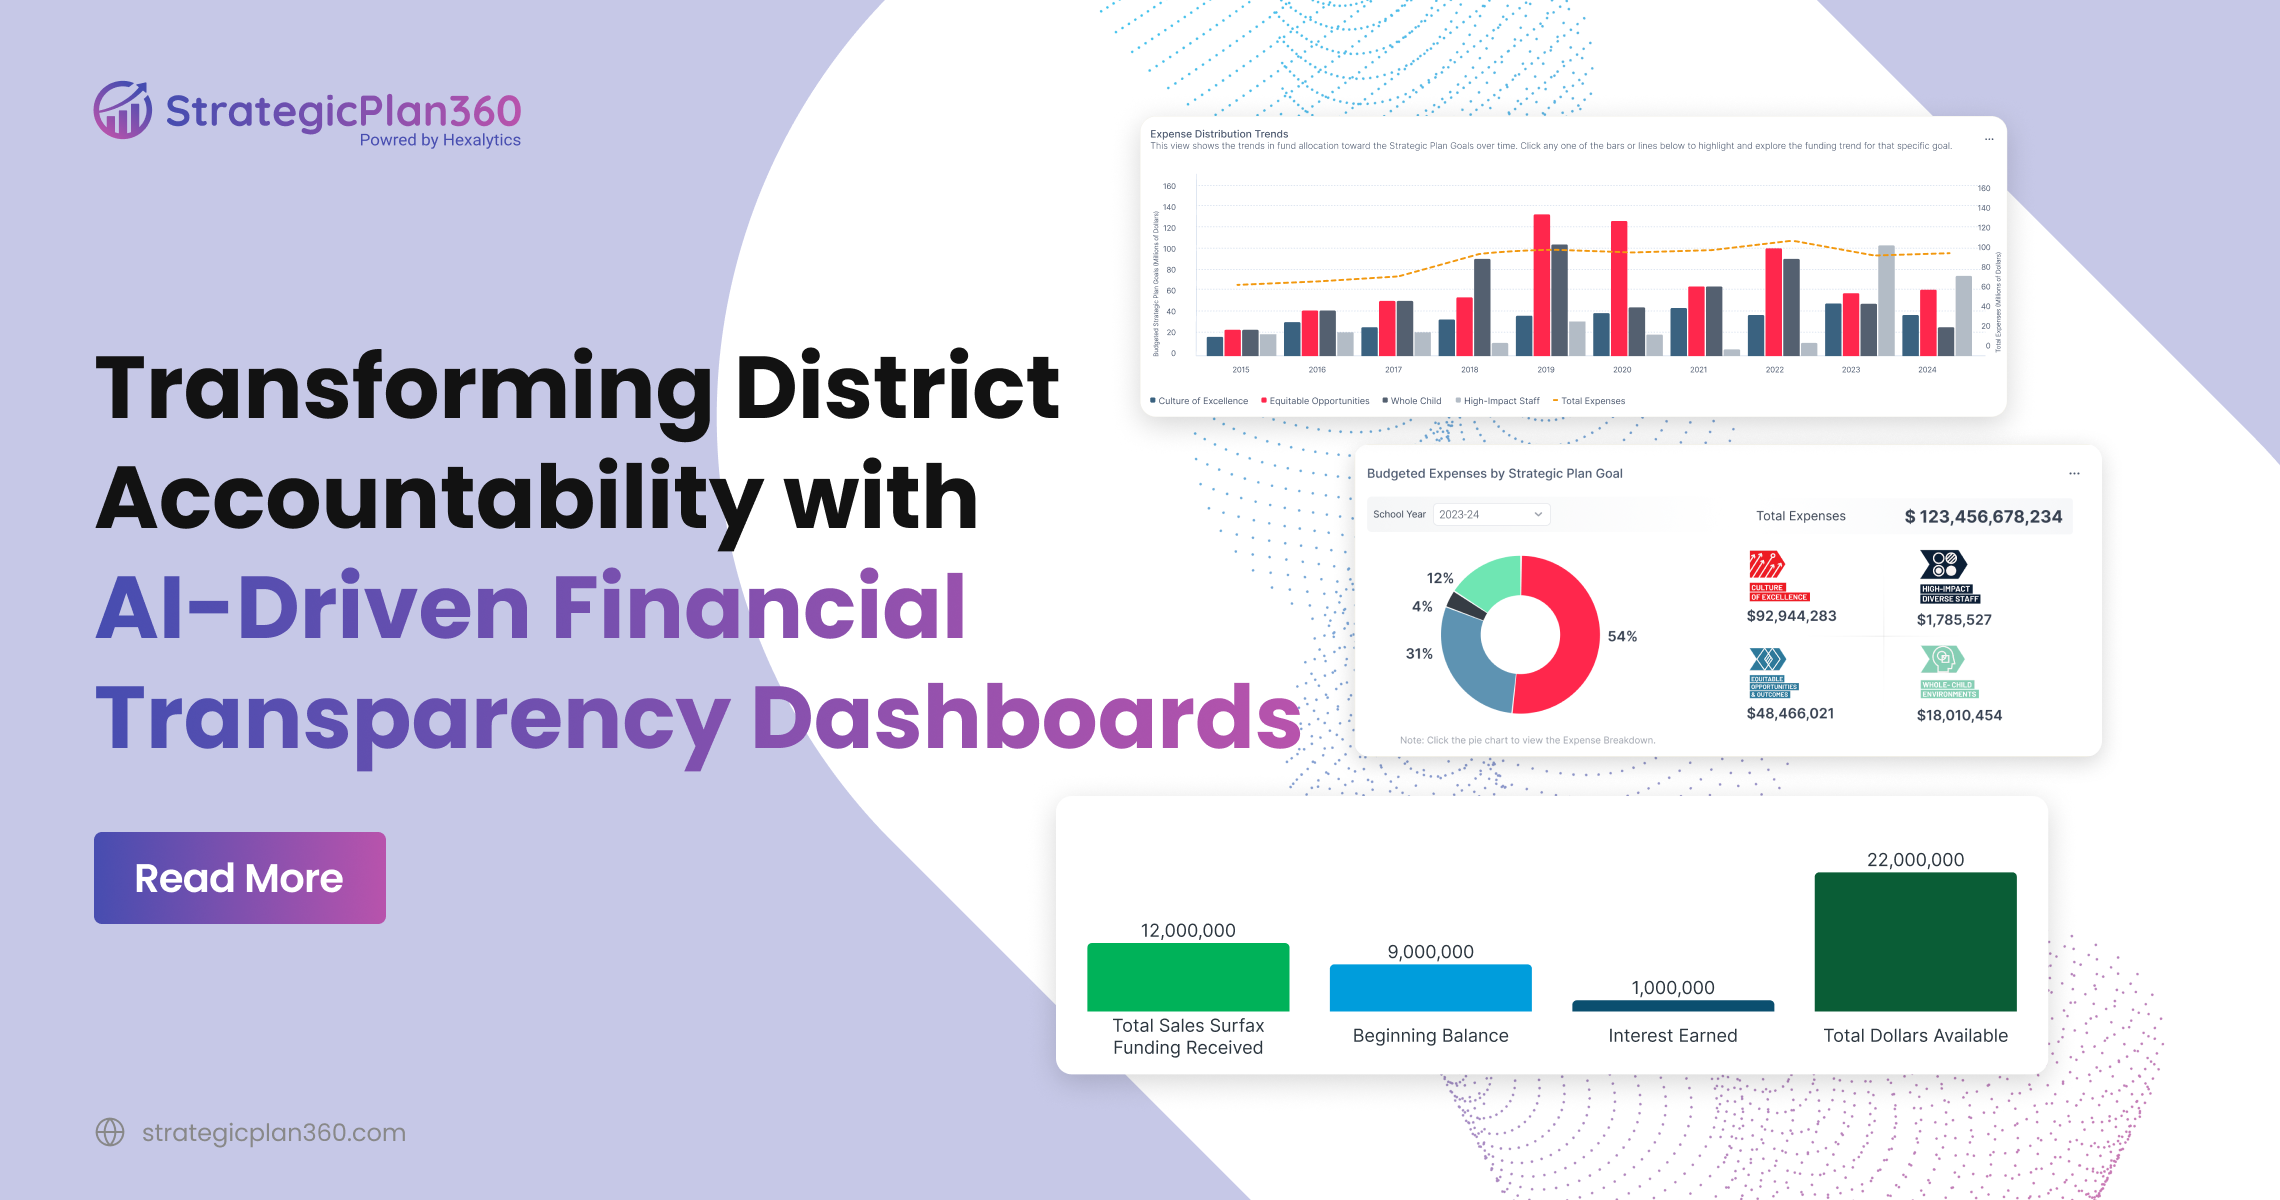
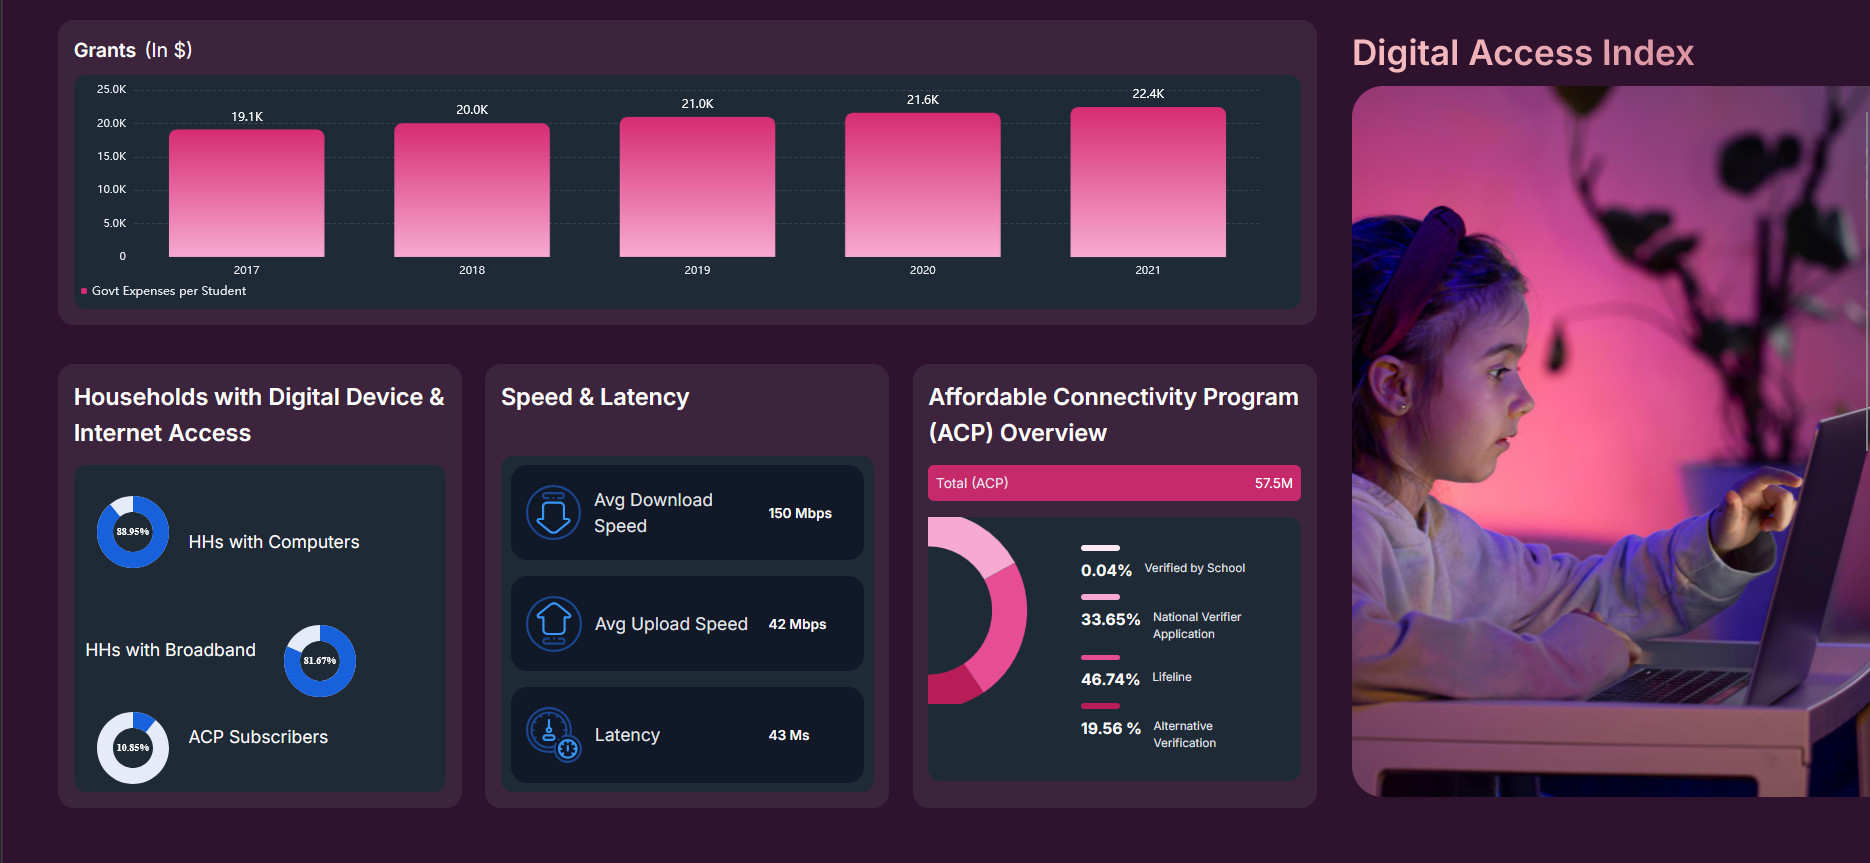
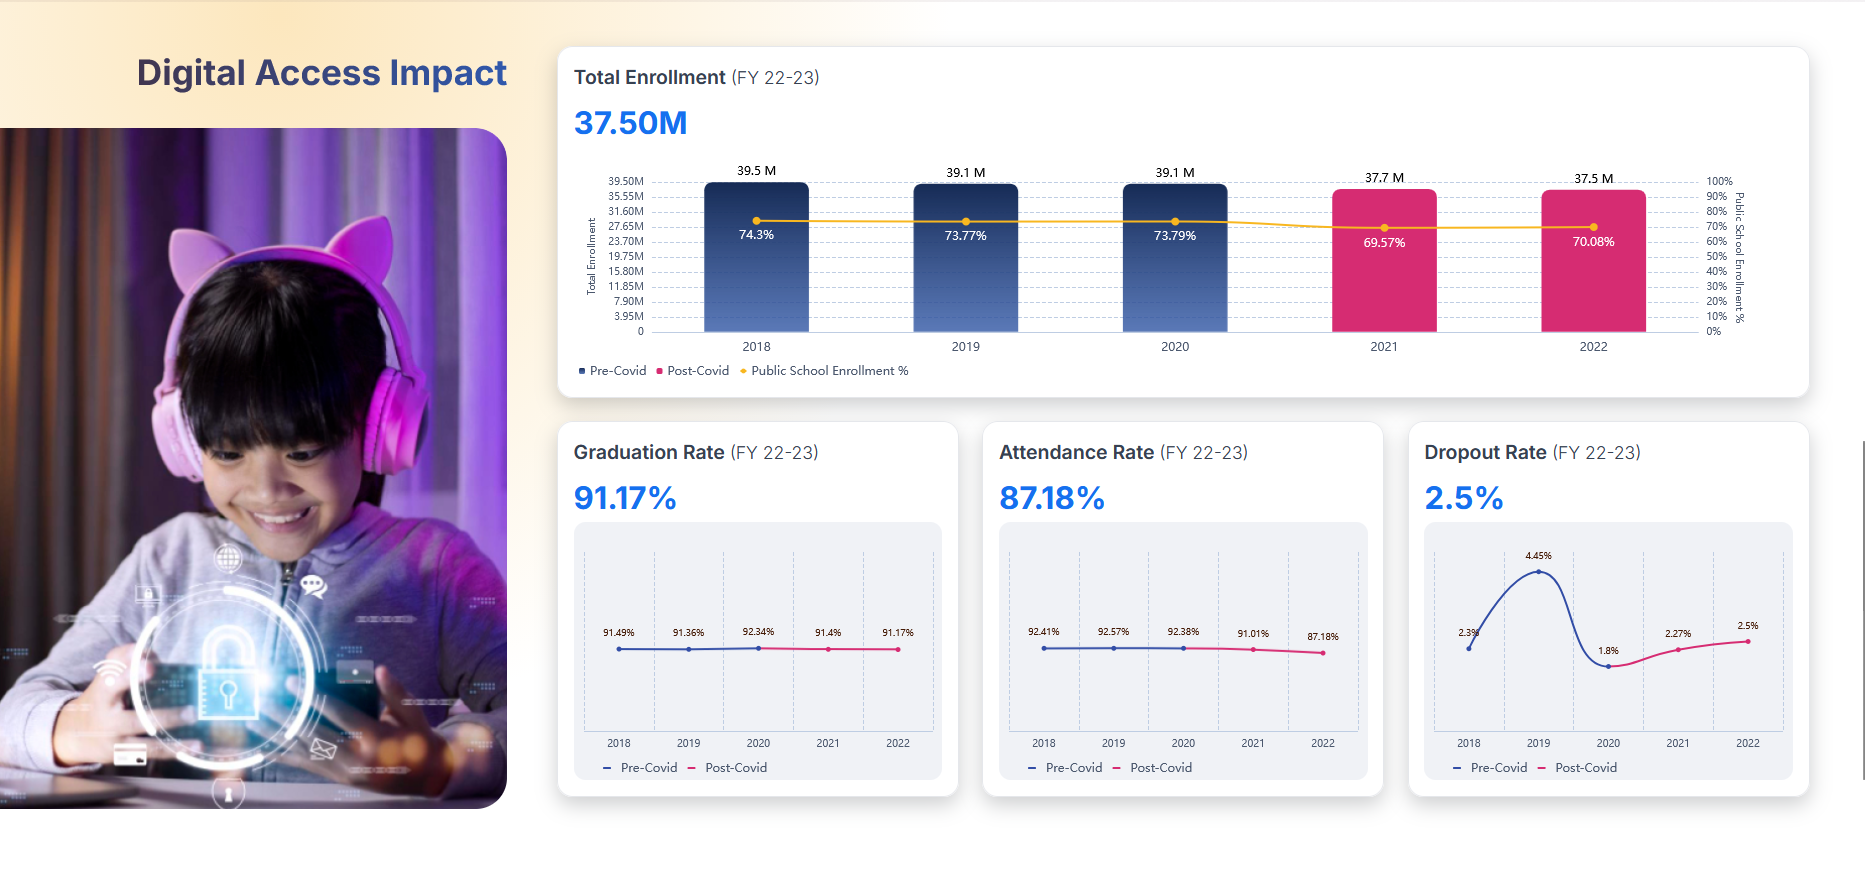
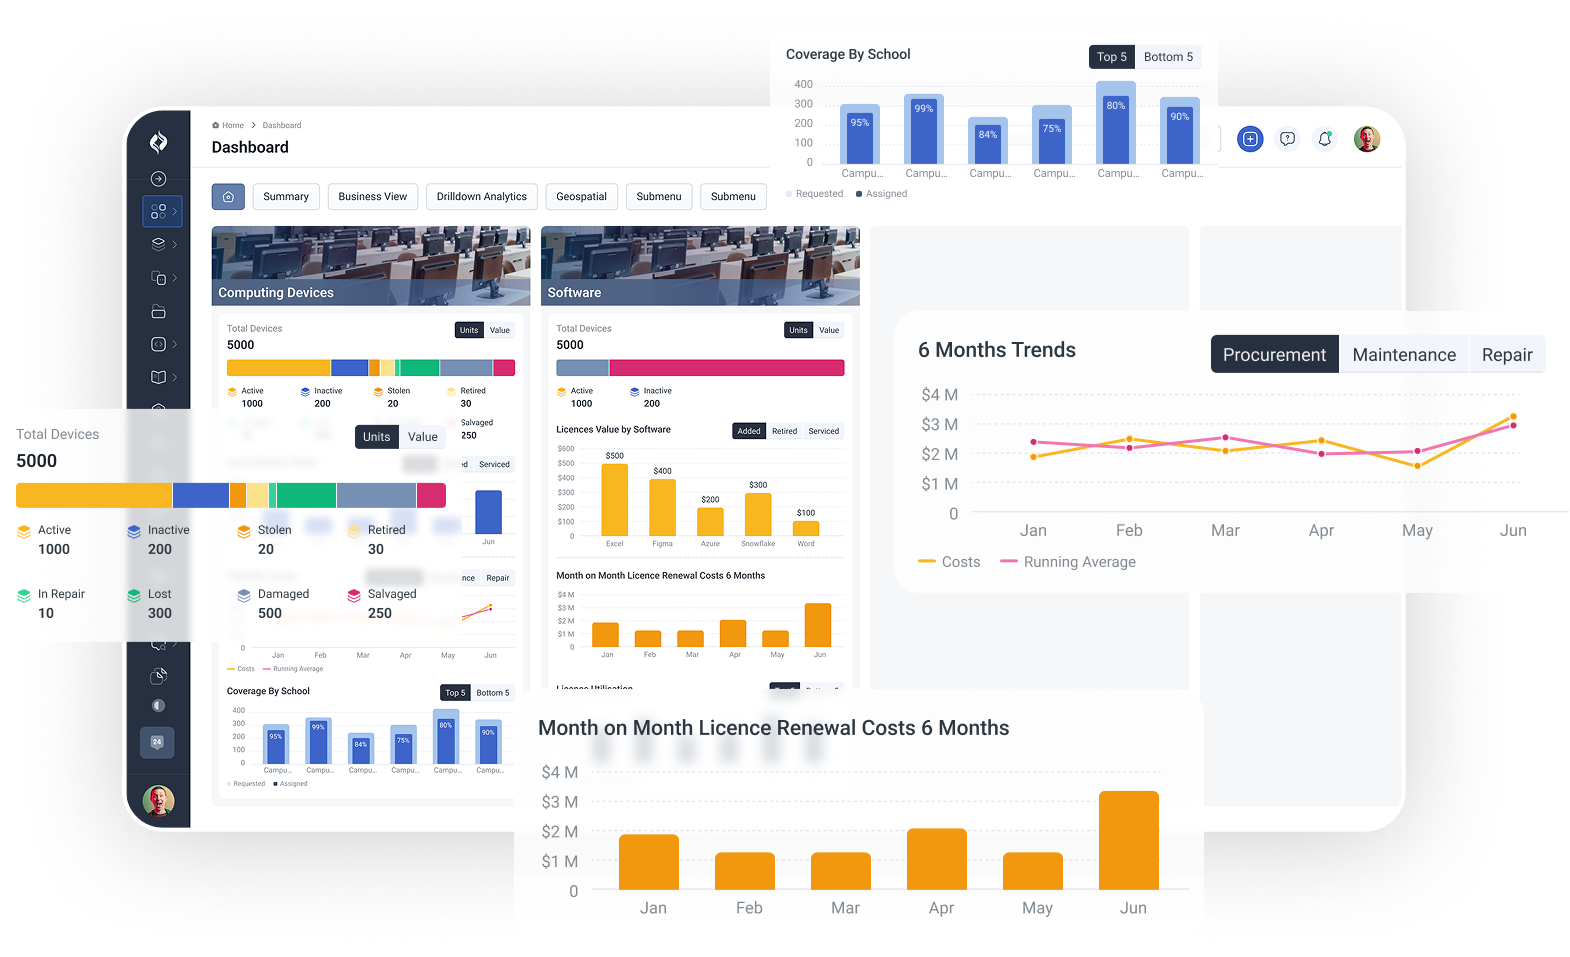
An AI powered Strategic Plan Dashboard helps by providing real-time enrollment and budget updates. Leaders can track student counts, anticipate funding changes early, model scenarios, and allocate resources with clarity. This strengthens long-term planning and reduces reactive adjustments. 

Teacher Shortages, Staffing Challenges and Operational Complexity

Staffing continues to be a major concern for districts. Reports from the U.S. Commission on Civil Rights https://www.usccr.gov highlight ongoing teacher shortages, especially within special education, and continued challenges with recruitment and retention. 

This affects staff capacity and instructional stability. At the same time, leaders manage multiple systems that include staffing, performance, budgeting, compliance, and reporting. 

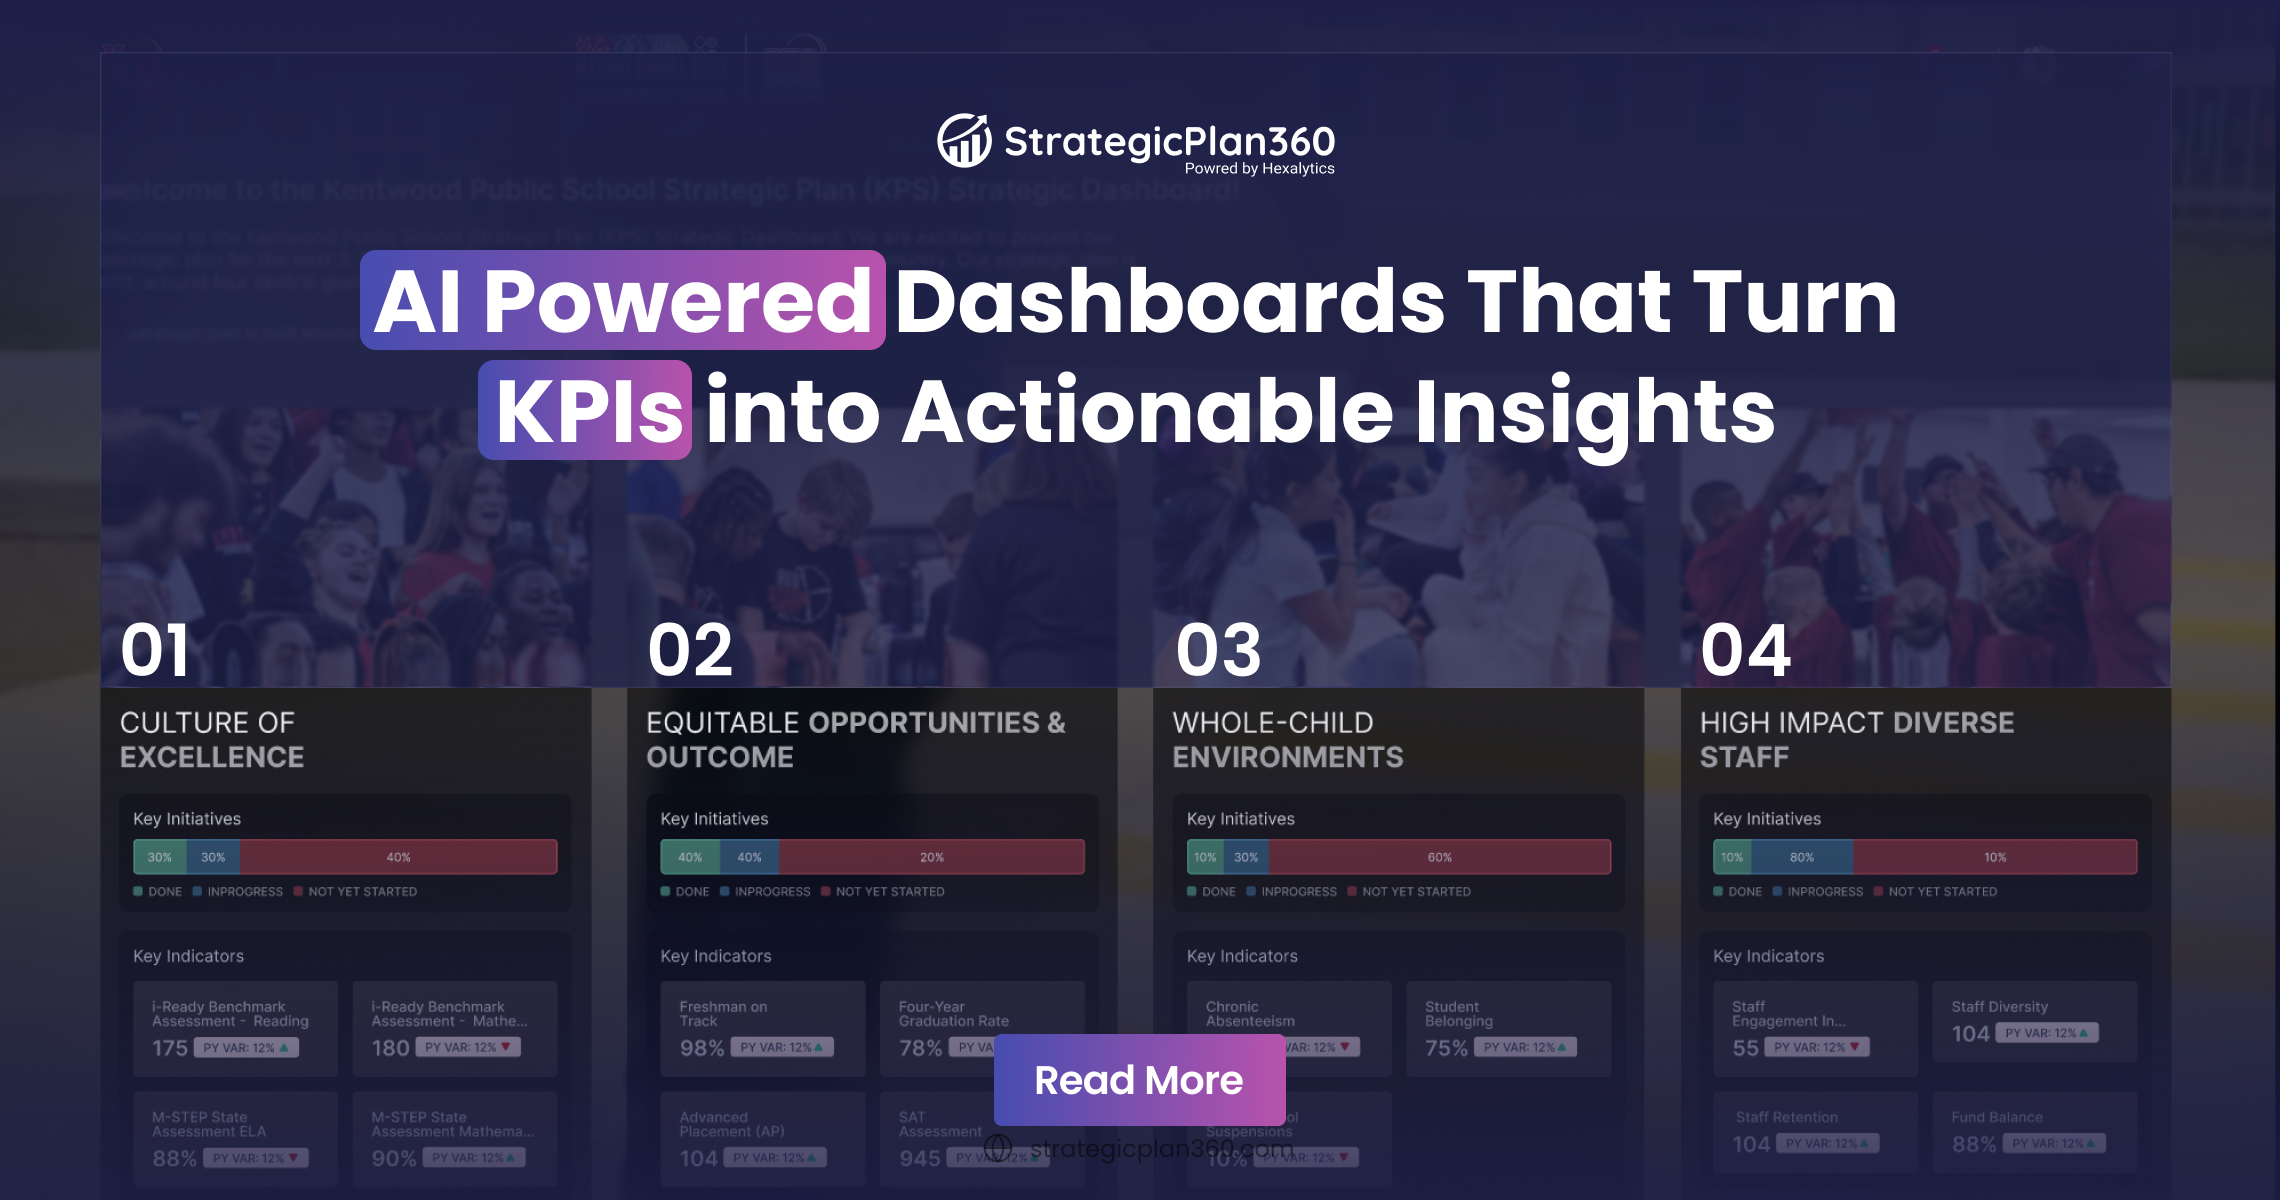
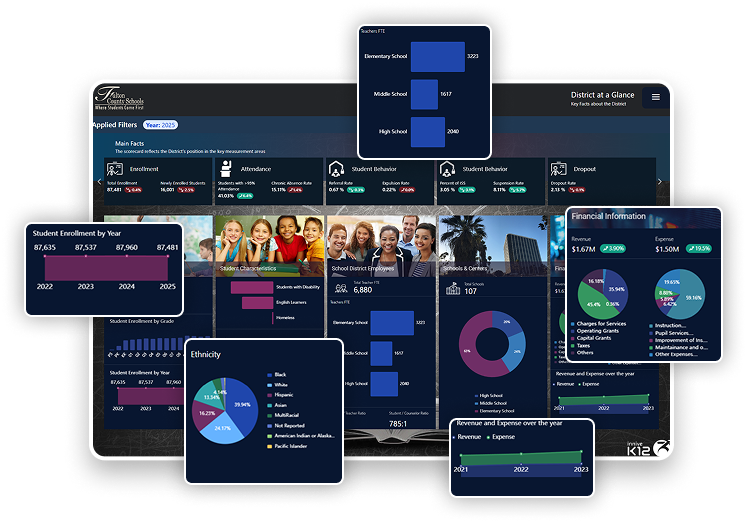
A Strategic Plan Dashboard brings these critical elements into one unified view. Districts can track vacancy trends, turnover, staffing load, class sizes, and performance indicators through clear visuals. This supports thoughtful workforce planning and more efficient resource alignment.

Need for Equity, Transparency and Accountability

Public demand for equity, inclusive programming, mental health support, and transparent reporting is growing steadily. According to Public School Review https://www.publicschoolreview.com and Elevate K12 https://www.elevatek12.com, community expectations for clarity and visible progress are higher than ever. 

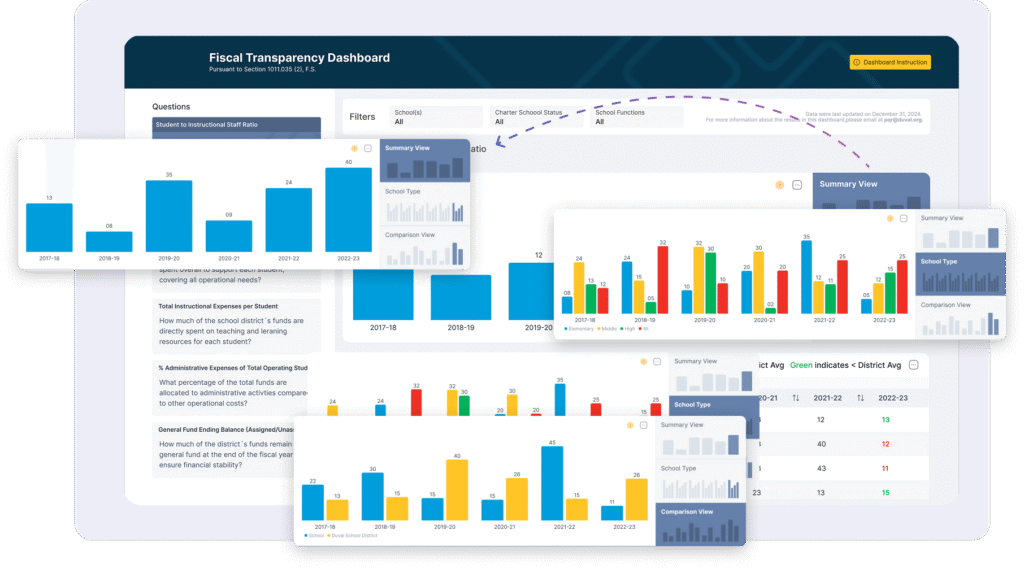
Traditional strategic plans often remain in static documents and do not support real-time decision making. 

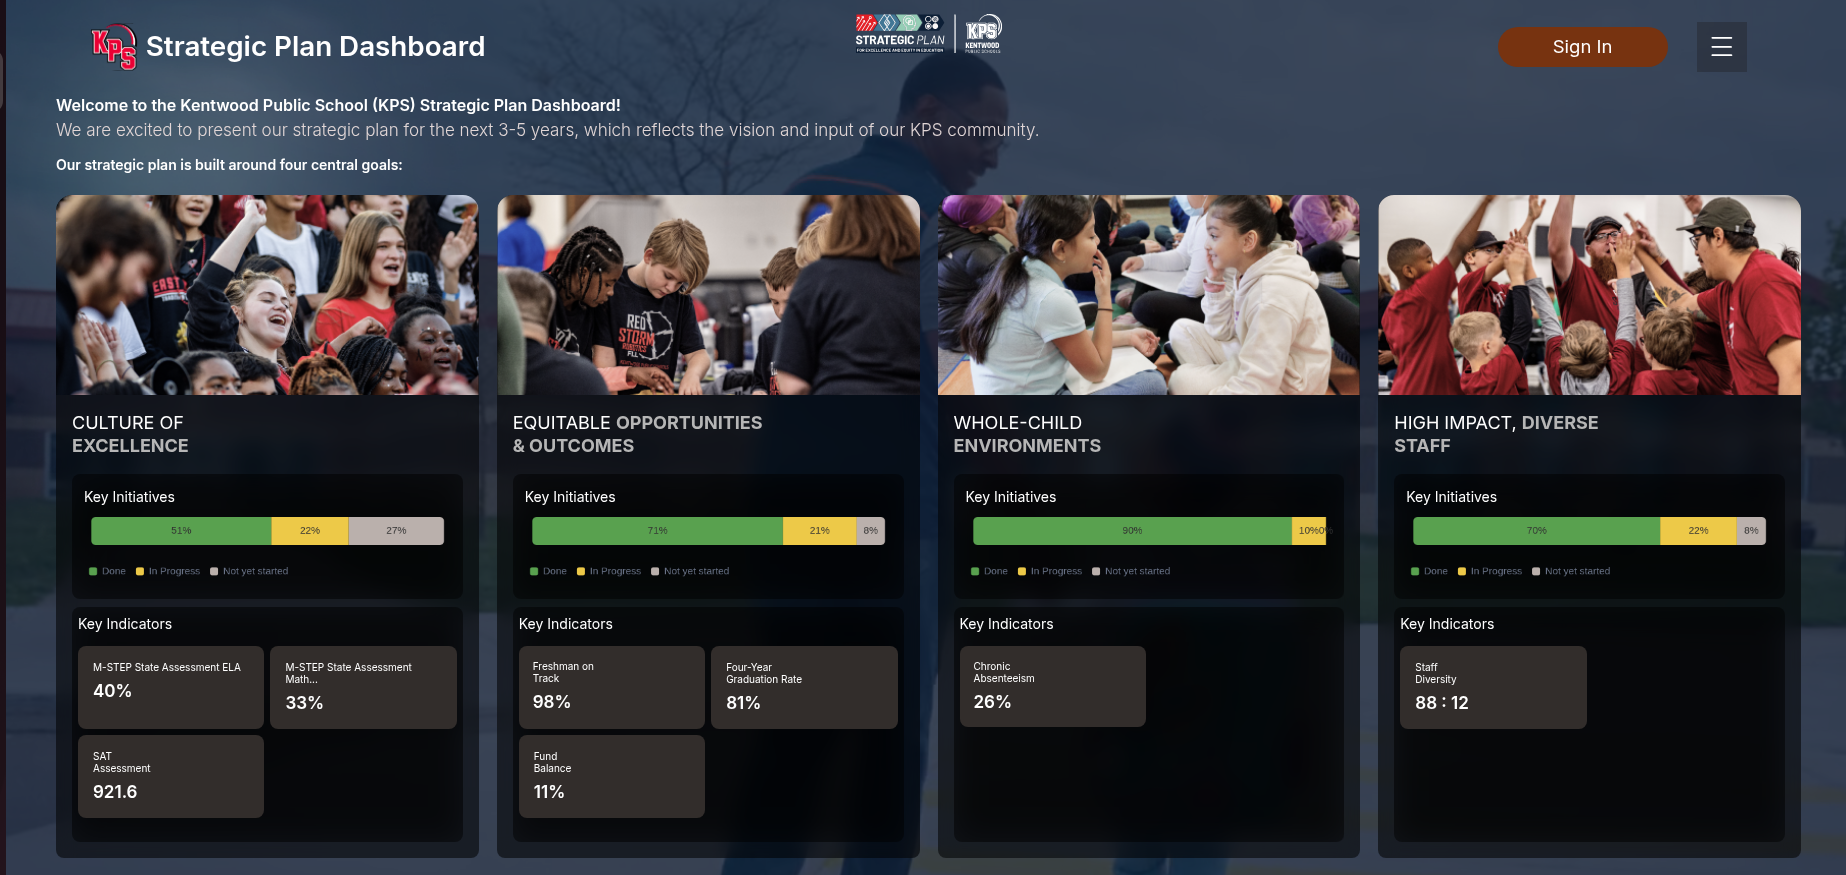
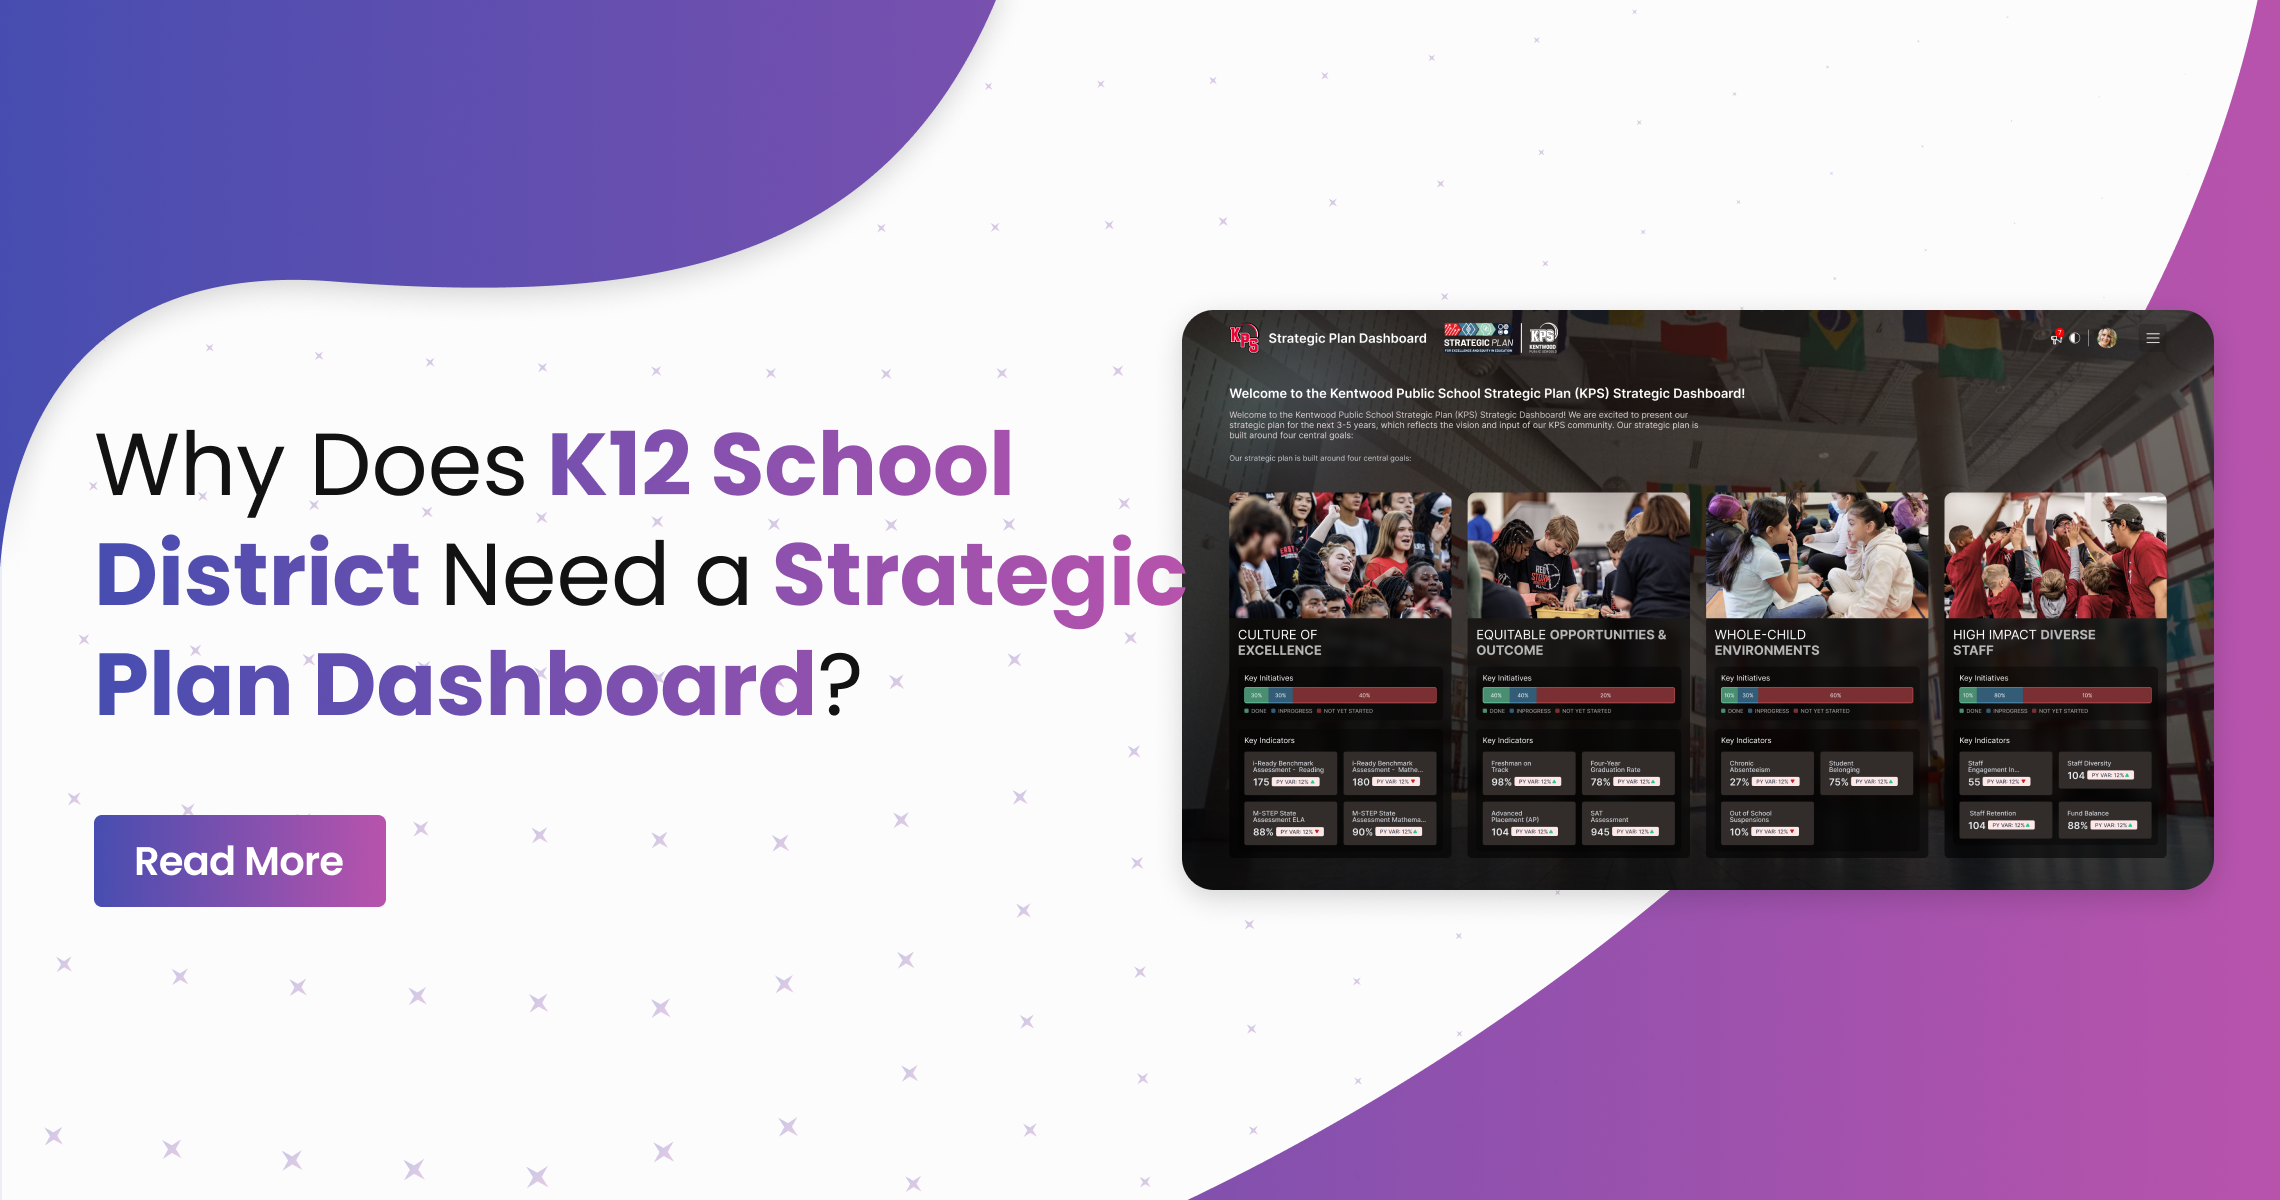
An AI powered dashboard changes this. It brings clarity to equity indicators, academic outcomes, student services, and resource distribution. Leaders can respond early when disparities appear and communicate progress confidently to their communities. Strategic plans become active and measurable.

How an AI Powered Strategic Plan Dashboard Makes Strategy Work

When deployed with intent, a dashboard becomes more than a reporting tool. It becomes the operational backbone of district leadership. 

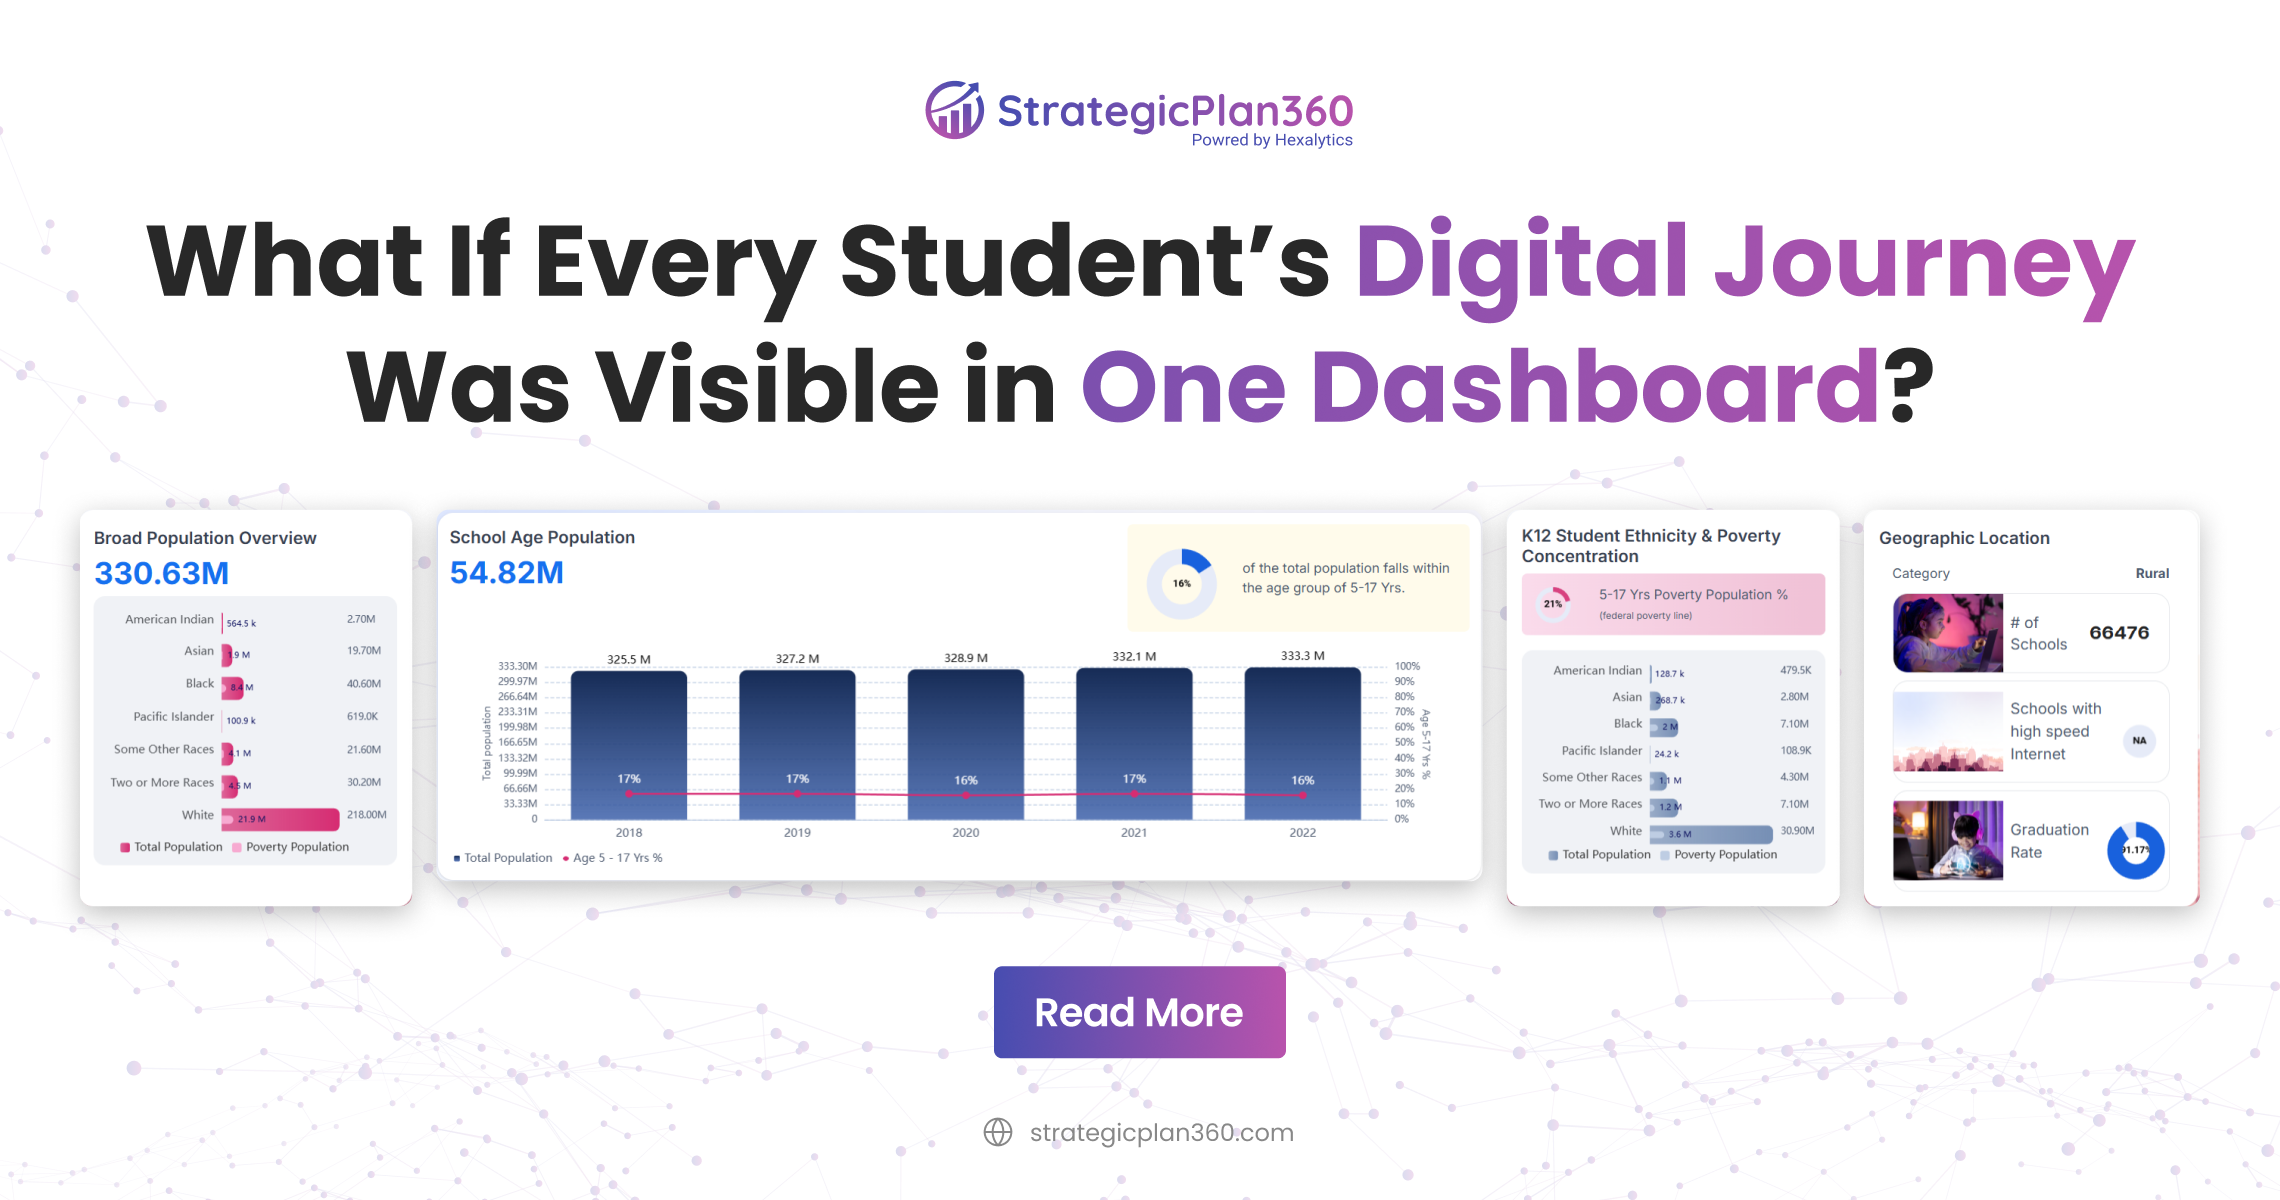
Unified real time data integration 
Data flows from SIS, HR, finance, assessments, and program systems into one connected view. 

Dynamic KPI tracking and alerts 
Enrollment trends, academic performance metrics, staffing indicators, and equity data are monitored continuously. 

Scenario planning and forecasting 
Leaders can test future conditions such as enrollment shifts or financial adjustments and prepare with confidence. 

Transparency and communication 
Boards, staff, families, and communities gain easy to understand visuals that build trust. 

Continuous improvement and decision making 
Districts move from static planning to ongoing review, monitoring, and action. 

Conclusion

K12 districts are operating in an environment that demands clarity, speed, and alignment. Strategic plans can no longer remain static. They must evolve with real time conditions, operational insights, and clear visibility. 

An AI powered Strategic Plan Dashboard transforms the strategic plan into a living system. It brings together the data leaders to depend on, highlights what matters, and supports confident decisions. 

Strategic Plan 360 powered by Hexalytics is built for this moment. It transforms strategic planning into continuous, actionable, leadership-ready insight.

Smart FAQs

1.How does a Strategic Plan Dashboard help districts manage declining enrollment?

It provides real time enrollment visibility, early warnings, and scenario modeling that help leaders adjust staffing and budgets with confidence.

It brings staffing data into one place, allowing leaders to track vacancies, turnover, class sizes, and performance trends to improve workforce planning

It tracks equity indicators, student support levels, and academic outcomes in real time, helping districts share clear progress with families and stakeholders.

Yes. It consolidates data from SIS, HR, finance, assessments, and student services into one unified system, reducing manual reporting across teams.

Scenario planning features help leaders prepare for future enrollment changes, budget variations, and instructional priorities.

Give your district a strategic plan that guides action every day, not once a year. 
Discover how Strategic Plan 360 powered by Hexalytics turns your goals into real time progress, actionable insight, and leadership ready visibility. 
Request a live walkthrough and see your district’s strategy in motion.

K-12 Interpreter App for Schools: Smarter Language Access

Language is one of the most powerful connectors in education. When students and families understand the language used in school, learning becomes more engaging and meaningful. Gaps in learning by language increase as children progress through education, demonstrating the importance of addressing language barriers earlyUNESCO’s recent analysis highlights this clearly. Students who speak the classroom language at home show stronger reading outcomes, and this advantage grows as they move through school. By the secondary years, these students are forty one percent more likely to read with understanding.

Can technology help break down these barriers? This blog looks at the possibilities. 

As districts look for ways to strengthen communication with multilingual families, simple and dependable tools are becoming essential. A modern K12 Interpreter App supports this effort by making interpreter requests and translation needs easier for staff and more accessible for families.

The Language Barrier is Real. So Is the Solution.

When translation requests live in email, inboxes and interpreters are coordinated through spreadsheets, the system is bound to break. Delays happen. Families feel excluded. Staff are stretched thin, trying to keep up. And yet, the need for clear communication with parents has never been more important for student success.

Smarter Tools for Multilingual Engagement

The K12 Interpreter App is designed specifically for school districts. It brings every part of the interpretation and translation workflow into one centralized, secure space. 

Forget the patchwork of manual systems. With this app, schools can handle everything from real-time interpreter scheduling to multilingual documentation with speed and accuracy.

Key Features That Elevate School Communication

All Requests in One Place 
Staff can schedule interpreters, submit translation needs, and track progress from a single dashboard. 

Instant Student Lookup 
Just enter a student ID, and the platform pulls in all the relevant details to streamline the request process. 

Live Administrative Insights 
School and district leaders get a real-time view of interpretation trends, pending approvals, and service usage. 

Smart Calendars and Timely Notifications 
The platform keeps staff and interpreters in sync with built-in alerts and calendar integration. 

Secure, Role-Based Access 
Permissions are tailored to ensure the right people have access to the right information while protecting student privacy. 

Built for Custom Workflows 
Every district has its own way of doing things. The app adapts to local approval paths, user roles, and translation needs. 

Effortless Compliance and Reporting 
Whether preparing audits or analyzing service metrics, schools can generate detailed reports with a few clicks. 

From Friction to Flow: The New Standard in Language Access

Most platforms treat language access as a side feature. This app makes it the priority. Built specifically for K12 schools, it empowers districts to bridge language gaps, reduce coordination chaos, and build trust with multilingual families. 

The result is not just better interpretation management—it is stronger family engagement and improved student outcomes.

Your District’s Next Step Starts Here

Every parent deserves to feel informed and involved in their child’s education, regardless of the language they speak. With the right tools, your school can deliver on that promise.

About Strategic Plan 360, powered by Hexalytics.

We help district leaders turn goals into measurable progress. Our dashboards unite academics, operations, finance, and HR in one clear view, enabling leaders to track goals, align resources, and build accountability. Grounded in clarity and transparency, our approach helps every team stay aligned and focused on meaningful outcomes for students. 

Ready to Experience Your School’s New App? 
Request a demo today and discover how the K12 Interpreter App transforms communication in your district. 

Frequently Asked Questions

1. What does the K-12 Interpreter App actually do?

It manages interpreter scheduling, translation requests, documentation, and reporting in one centralized platform for schools and districts.

Schools log in through a secure district portal. Staff receive role-based accounts to submit requests, schedule interpreters, and track progress.

Yes. It supports interpretation and translation across all major languages used in K-12 districts.

Yes. District leaders can view detailed dashboards showing service requests, languages used, high-demand schools, interpreter workload, and overall trends.

Districts request a demo, complete onboarding, and the platform is configured to match local workflows and approval processes.

How Schools Strengthen Cybersecurity with Real Time Insight

Introduction

The education sector is now one of the easiest targets for cybercriminals. Intel reports that one in three school devices holds sensitive student data, 87 percent of institutions have already faced at least one cyberattack, and education experiences more ransomware incidents than any other industry. 
Source: https://www.intel.com/content/www/us/en/education/it-in-education/cyber-security.html  

When districts carry this level of exposure, the real challenge is not whether security tools exist, but whether leaders can actually see what is happening across their environment. Most teams are working with fragmented systems, delayed updates, and dashboards that only show part of the picture. In this kind of landscape, the question shifts from “Are we secure?” to “Do we understand our risk in real time, across every system we depend on?” 

This is where the Cybersecurity 360 Dashboard by Hexalytics becomes essential because meaningful protection starts with clarity, not assumptions.

What This Blog Explores

We’ll walk you through how this solution transforms fragmented cybersecurity data into a clear, unified intelligence layer. Whether you’re managing your data security, tracking vulnerabilities, or planning incident responses, this is a smarter, faster way to lead. 

A Live Pulse on Your Security Environment

The Summary Module gives CIOs, CISOs, and risk teams something rare—instant clarity. From asset posture to threat activity, leaders can view everything in real time, helping them reduce risk in the future by securing today. 

Gone are the days of relying on last week’s spreadsheets or waiting for email updates. Now, your cybersecurity consulting services & strategy are driven by what’s happening right now. 

Here’s What’s Inside the Cybersecurity 360 Dashboard

Asset Management 
Know what you have, where it lives, and how critical it is. Every server, endpoint, cloud asset, and IoT device is tracked, classified, and valued. 

Security Operations 
Vulnerability management is reimagined. Incidents and patch needs are prioritized based on business impact, helping SOC teams close gaps faster and smarter. 

Access Intelligence 
Monitor login events, MFA performance, privilege levels, and account modifications. Everything is traceable, policy-aligned, and secure. 

Control Effectiveness 
Measure your defense, don’t just deploy it. Track how often security controls work, where gaps exist, and how long they hold under pressure. 

Information Classification 
From internal to confidential to public, your data is organized and protected. Get insights on sensitivity trends and breach of indicators. 

Risk Management Hub 
This is where governance becomes real. Align compliance, audit findings, and risk assessments in one place that turns strategy into operational action. 

Hexalytics Pulse Alerts 
Stay connected with live notifications and analytics delivered directly to any smart device. Because visibility should never depend on your location. 

Designed for Strategic Security

This is not just about dashboards. It’s about redefining how cybersecurity consulting services and strategy come together in a way that builds resilience across the entire organization. 

Hexalytics embeds security within your ecosystem—tying together asset management, endpoint security, cloud protection, incident response, and threat detection into one intelligent, responsive system. 

Whether you’re focused on risk management, vulnerability tracking, or incident readiness, Cybersecurity 360 aligns every metric to performance, giving leaders full control over today’s actions and tomorrow’s outcomes. 

Built for Today. Ready for What’s Next.

Hexalytics created this platform with the understanding that cybersecurity services should not only protect but also empower. That means clear metrics, integrated controls, and systems that support decision-makers at every level. 

It also reflects the qualities of the best cybersecurity services in the USA trusted, scalable, and built for organizations that value visibility, accountability, and action.  

You already have security tools in place. The Cybersecurity 360 Dashboard brings them together, so they work smarter, not harder. 

About Strategic Plan 360, powered by Hexalytics

We helps district leaders turn goals into measurable progress. Our dashboards unite academics, operations, finance, and HR in one clear view, enabling leaders to track goals, align resources, and build accountability. Grounded in clarity and transparency, our approach helps every team stay aligned and focused on meaningful outcomes for students. 

See how a unified dashboard transforms your cybersecurity strategy. 

Connect with our team for a personalized Cybersecurity 360 demo 

Frequently Asked Questions

1. How is the Cybersecurity 360 Dashboard different from traditional security tools?

Most tools only show isolated data. Cybersecurity 360 unifies asset intelligence, vulnerabilities, access activity, compliance records, and system health into one real-time dashboard. 

Yes. Cybersecurity 360 is designed to connect with existing systems – vulnerability scanners, endpoint tools, cloud security services, and more so organizations do not replace tools; they unify them.

Absolutely. It supports P–12, higher education, state agencies, and enterprise sectors with flexible modules that adapt to different organizational structures and security needs.

Absolutely. It supports P–12, higher education, state agencies, and enterprise sectors with flexible modules that adapt to different organizational structures and security needs.

Yes. The Risk Management Hub consolidates compliance tasks, audit findings, risk assessments, and governance metrics into one location, making preparation and reporting significantly easier. 

Transforming District Leadership with K-12 Portfolio Management

Imagine if all your school district’s data, tools, and dashboards lived in one secure platform no more juggling multiple logins or clicking through countless browser tabs.

With everything integrated, you get the full story at a glance, and every decision becomes easier and faster. This isn’t a far-fetched dream; it’s exactly what the K-12 Portfolio Management is designed to deliver.

It transforms a fragmented digital environment into a unified K-12 digital ecosystem, where insight and clarity are at your fingertips.

The Power of K-12 Portfolio Management

A unified portfolio management solution brings all your district’s critical systems into one convenient hub. Superintendents, principals, data teams, and teachers can all access the same central portal to find the information they need.

Instead of constantly switching between your student information system, finance software, HR tools, and various academic dashboards, you find everything in one place.

As a result, district leaders can make data-driven decisions in real time, and educators spend more time supporting students instead of dealing with tech hassles.

What Can You Do with an Integrated Platform Like This? Plenty:

Instant Access to Everything: Log in once to securely reach all approved apps, reports, and data dashboards across the district.

Centralized Control: Manage user roles, app licenses, and permissions from one console, ensuring the right people have the right access at all times.

Usage Insights: Track which tools and platforms are being used (and which aren’t) to learn what’s truly valuable for your staff and students.

Aligned Goals: Connect instructional goals with operational data to see the bigger picture across student achievement, budgets, and attendance.

Support for Every Role: Whether it’s a teacher checking a student’s progress or a superintendent reviewing district trends, every user gets a tailored experience on the same platform.

Three Suites, One Unified Solution

It’s not just a single tool – it’s a comprehensive portfolio management solution composed of three interconnected suites. Together, these suites form the backbone of a smarter, more efficient district.

Analytics Suite – Real-Time Insights

Say goodbye to data silos. The Analytics Suite pulls together information on student attendance, academic performance, behavior incidents, and more into real-time dashboards. District and school leaders can instantly spot trends and identify areas that need attention.

Imagine spotting a rise in reading scores at certain schools and drilling down by grade or classroom to find what’s driving it. With all your data in one place, you can explore growth patterns, pinpoint gaps in equity, and respond proactively with informed strategies.

Leadership & Operations Suite – Centralized Management

Managing a school district involves many moving parts, from enrollment and HR to finance and compliance. The Leadership & Operations Suite centralizes these functions so that operational data stays aligned with district strategy.

Enrollment teams can handle applications and lotteries through the same unified system used for HR onboarding and budget tracking. Instead of separate, siloed software for each department, this suite provides a single source of truth for all district operations.

Instruction & Learning Suite – Empowering Classrooms

The Instruction & Learning Suite bridges the gap between classrooms and district leadership. It integrates curriculum planning tools, learning management system data, professional development tracking, and EdTech usage analytics.

Teachers and instructional coaches can see how students are progressing and adjust instruction accordingly. At the same time, district leaders gain insight into how curriculum initiatives or technology investments are impacting student engagement and success.

How K-12 Portfolio Management Delivers

A unified K-12 Portfolio Management system can turn a maze of disconnected systems into a seamless, intelligent ecosystem, making it easier for districts to align strategies, measure progress, and adapt quickly to new challenges.

When every piece of data and every application come together, the result is a school district that can truly lead with clarity and insight, benefiting educators and students alike.

Ready to see how unified portfolio management transforms district leadership?
Schedule your walkthrough and unlock a complete, connected view of your district.

Transforming District Accountability with AI-Driven Financial Transparency

How AI Turns Data into Trust

For district leaders, the real question isn’t how much you spend, it’s how clearly you can show it. 

When communities can see how funds are managed, trust follows. When leaders can visualize data in real time, accountability becomes a culture. 
The Financial Transparency Dashboard, built by Hexalytics, bridges data, people, and purpose. It helps districts simplify financial complexity and communicate their impact clearly.

When combined with AI powered dashboards, KPIs evolve from static metrics into continuous insight empowering educators to lead with precision and awareness.

The New Standard for K-12 Finance

Every transaction tells a story of how funds reach classrooms, programs, and students. Yet this story often remains buried in spreadsheets.  

The Financial Transparency Dashboard changes that. It visualizes data from SIS, ERP, and accounting systems, allowing anyone from finance teams to families to explore how resources align with priorities.

Empowering Every Stakeholder

  • For District Leaders: A unified command center for tracking, planning, and forecasting. 
  • For Boards: Clear visuals that support informed decision-making. 
  • For Communities: Transparent, interactive data that strengthens public trust. 

More Than Numbers — A Narrative

Through simple visuals and real-time automation, districts can show not just how much they spend, but why they spend it.  

AI insights reveal trends, highlight outliers, and identify where adjustments can improve results. This turns finance into a living narrative of progress and purpose.

Benefits Beyond Compliance

  • Enhances community confidence 
  • Improves budgeting accuracy 
  • Reduces manual reporting workload 
  • Aligns financial choices with student outcomes 

Built for Real-World Districts

From large urban systems like Duval County to mid-sized districts like Kentwood, the goal remains the same make data open, accurate, and human friendly. Hexalytics helps every district, regardless of size, achieve financial transparency that builds connection and accountability.

FAQs

Can the Financial Transparency dashboard show trends and patterns?

Yes. Trend analysis tools help identify year-over-year spending patterns for proactive planning.

Yes. It connects seamlessly with SIS, ERP, and accounting platforms to keep data consistent.

Yes. Users can filter by school, program, or expenditure type in just a few clicks.

Does Financial Transparency integrate with multiple financial systems? 
Yes. It connects seamlessly with SIS, ERP, and accounting platforms to keep data consistent. 

Our Approach

Strategic Plan 360 helps district leaders turn goals into measurable progress. Our dashboards unite academics, operations, finance, and HR in one clear view, enabling leaders to track goals, align resources, and build accountability. Grounded in clarity and transparency, our approach helps every team stay aligned and focused on meaningful outcomes for students. 

Let’s talk about what real financial transparency means for districts today.
Explore how Hexalytics helps districts turn financial data into a shared story of accountability and progress. 

Strategic Plan 360, powered by Hexalytics. 

AI Powered Dashboards That Turn KPIs into Actionable Insights

What if every goal your district sets could show its progress in real time?
Across schools today, leaders want to see how efforts translate into outcomes not at the end of the year, but as they unfold.

That vision is becoming reality with AI powered dashboards that bring Key Performance Indicators (KPIs) to life. These dashboards don’t just display numbers; they tell the ongoing story of how a district is growing, improving, and shaping its future.

Why KPIs Matter More Than Ever

Every strong district begins with clear goals. Yet goals alone cannot drive improvement unless leaders can see how each one is progressing. That’s where KPIs play their role. They translate priorities into measurable signals, helping every team understand whether initiatives are working and what needs attention next.

When combined with AI powered dashboards, KPIs evolve from static metrics into continuous insight empowering educators to lead with precision and awareness.

How Strategic Plan Dashboards Bring KPIs to Life

The Strategic Plan Dashboard used in districts such as Kentwood Public Schools shows what this looks like in practice. Each district priority is supported by KPIs that reflect the full story of learning, leadership, and growth.

  • Culture of Excellence: Monitors academic progress through test performance, learning growth, and graduation readiness.
  • Equitable Opportunities and Outcomes: Follows college and career readiness, access to advanced learning, and inclusive success across student groups.
  • Whole Child Environments: Tracks attendance, well-being, and engagement to ensure every student feels supported and motivated.
  • High Impact Diverse Staff: Observes staff development, leadership pathways, and retention that build a stronger district community.

Beyond these areas, the dashboard also includes operational views such as budget planning, resource allocation, and board reporting. It gives every leader a clear, complete picture of how the district is performing.

From Indicators to Insight

Artificial intelligence strengthens these dashboards by turning raw information into meaningful direction. When attendance drops or student participation shifts, the dashboard highlights those changes early. Leaders can respond before challenges affect outcomes.

A study on education systems notes that consistent use of performance indicators leads to measurable improvement when decisions are informed by ongoing analysis.

That is exactly what AI powered dashboards achieve, transforming performance indicators into day-to-day guidance.

Core KPIs That Power District Progress

Every KPI inside the Strategic Plan Dashboard aligns to an outcome that moves the district forward:

  • Student Growth — Achievement, readiness, and performance patterns.
  • Attendance and Engagement — Real participation across classrooms.
  • Early Alerts — Behavior, wellness, and support indicators that shape timely interventions.
  • Instructional Impact — Curriculum strength and program effectiveness.
  • Resource Use — Budget, staffing, and materials tied to district priorities.
  • Access and Inclusion — Equal opportunities for students across all schools.
  • Operational Health — Facilities, transportation, and board-level metrics for community transparency

Each indicator builds on another, giving superintendents, principals, and school boards a single, reliable source of progress.

The Story Behind the Numbers

In practice, KPIs work best when they are more than figures on a screen. The Strategic Plan Dashboard allows every department to interpret and act on the same set of indicators. Teachers can see how instructional strategies are supporting growth.

Principals can align resources to priorities. Superintendents can track the health of districtwide initiatives and share results transparently with the board and community.

This shared visibility nurtures collective ownership. Everyone sees the same progress and works toward the same outcomes. It turns reporting into shared leadership.

A New Chapter for District Growth

The real promise of AI powered dashboards lies in how they make KPIs personal and purposeful. They move the focus from managing information to leading change. Each goal becomes a story in motion one that shows effort, growth, and measurable results.

When districts understand their KPIs and view them through intelligent dashboards, planning becomes proactive, teaching becomes more focused, and collaboration becomes natural.

That is the future of leadership where AI powered dashboards turn KPIs into stories of real progress.

Transform your school’s data insights today with AI-powered dashboards built for action – Request a Demo.

What If Every Student’s Digital Journey Was Visible in One Dashboard

Hidden Inequities in Digital Access

Across districts today, one critical question remains unanswered: Do all students have an equal chance to connect and learn?

This blog explores how visibility into every student’s digital journey can reveal the hidden patterns behind access and equity.

From device availability to home internet quality, the challenge isn’t just collecting data—it’s seeing where the gaps truly lie. Many schools still lack a clear view of which students face connectivity issues and how they affect learning outcomes.

Why a Unified View Matters

A unified view is what turns disconnected information into real understanding. The Digital Access Dashboard brings together scattered datasets into one clear, interactive view—pinpointing exactly where disparities exist and why.

By connecting information on devices, broadband, socioeconomic conditions, and student outcomes, it helps leaders move from assumptions to evidence. The result is a complete understanding of how digital access shapes academic success, enabling timely, fair, and data-informed decisions.

Designed for Discovery

The dashboard brings a modern, interactive design built for exploration, not just reporting.

The Digital Access Index

The Digital Access Index acts as a pulse check for every district’s digital health.
It summarizes how well students, families, and schools are equipped to learn and connect.

This section showcases:

  • Per-student investment in technology and learning resources
  • Household access to computers, tablets, and broadband
  • Participation in the Affordable Connectivity Program (ACP)
  • Network quality metrics including upload and download speeds, and latency

The index brings these indicators together to help leaders understand overall readiness. When viewed over time, this index becomes a dynamic tool for tracking progress and planning investments that close the gap.

The Digital Access Impact: Connecting Access to Outcomes

Data means little unless it connects to results.
That is why the Digital Access Impact section focuses on educational outcomes linked to digital equity.

It tracks key indicators such as:

  • Enrollment and retention trends
  • Graduation and dropout rates
  • Year-over-year improvement in performance

These insights reveal how digital readiness shapes academic success.
Districts can identify early warning signs — declining engagement, rising absenteeism, or slow progress and respond before issues deepen.

By connecting access with achievement, the dashboard helps leaders see where equitable investment leads to measurable learning gains.

Geospatial Map Analytics
Interactive maps reveal where digital gaps appear across schools, neighborhoods, or communities.

With color-coded metrics and historical comparisons, leaders can easily track trends and benchmark progress against county, state, or national averages.

Access and Outcomes
This powerful section connects digital access directly with student performance indicators such as enrollment, graduation, dropout, attendance, and course results.

Users can filter by school level, grade, gender, or income to uncover meaningful patterns that guide policy and intervention.

A Global Perspective on Access and Inclusion

This vision connects with global movements to ensure that technology opens doors for every learner.
For instance, UNESCO continues to advance digital inclusion in remote and underserved communities through innovative technology initiatives.

Its mission is to make education accessible everywhere—mirrors the purpose of the Digital Access Dashboard: using data to remove barriers and create opportunities for all.

The Future of Digital Equity

Districts are rich in data yet still seeking deeper, more connected insights. The Digital Access Dashboard changes that by translating complex datasets into meaningful stories about access, equity, and performance.

By making every student’s digital journey visible, this platform turns data into a force for fairness.

Districts that use these insights are not just closing digital gaps—they are creating a foundation for lasting educational equity.

Because when every student is seen, every student has a chance to succeed.

Ready to uncover your district’s digital story? Explore how the Digital Access Dashboard helps every district create pathways where every learner can thrive.

Let’s explore it together

AI-Powered ITSM for School Districts

Smarter IT Starts with Simplicity

Technology is now as essential to learning as teachers and textbooks once were. Every digital tool, from smartboards to student laptops, depends on an IT system that works quietly in the background.

But today’s school districts face new challenges of scale, speed, and rising expectations. Managing technology has become less about fixing issues and more about sustaining the rhythm of learning.

That’s where smarter, connected IT management becomes the foundation of progress.

We’ll dive into how Hexalytics IT Service Management (ITSM) simplifies complexity and redefines efficiency for K–12 districts.

Discover how one unified platform brings every request, device, and workflow together — turning IT from a reactive function into a strategic driver of student success.

Why ITSM Matters for K–12

Traditional help desk tools aren’t built for the complexity of K–12 environments. Modern ITSM platforms like Hexalytics ITSM offer a smarter alternative: a single, intuitive hub to manage all tech requests, automate workflows, and monitor performance in real time.

Districts using ITSM report better response times, fewer bottlenecks, and more satisfied users. It’s not just about fixing what’s broken — it’s about transforming IT from reactive support into a proactive engine for teaching and learning.

Key Benefits of ITSM for Schools

Unified Service Desk
All IT requests and incidents—password resets, software installs, network issues—live in one streamlined dashboard. Staff and teachers can submit tickets, track status, and get updates without switching platforms.

 Smart User Portal
An intuitive “My Tickets” view empowers end users to log issues, follow up, and stay in the loop—no tech expertise needed.

 Technician Workbench
IT teams get powerful tools to organize tickets by priority, status, and category. Built-in metrics and filters make it easy to stay on top of workloads.

 Integration with Asset Fusion
Every ticket is connected to its associated device, app, or asset. Whether it’s a laptop or projector, tech teams get full context for faster resolution.

AI-Powered Automation
AI handles repetitive requests, suggests solutions, and routes tickets automatically. Less time on manual tasks means more time for high-impact work.

Real-Time Dashboards & Reporting
Track ticket trends, technician performance, and resolution times with visual dashboards. Get insights that drive smarter planning and faster decisions.

Built for Education

What sets Hexalytics apart? It’s purpose-built for schools.

Whether you’re supporting 5 campuses or 50, Hexalytics ITSM is designed to handle the speed and scale of K–12 operations. From integrating with district systems to aligning with school-year timelines, it works the way your district works.

And because it’s part of the Hexalytics ecosystem, it integrates seamlessly with Asset Fusion 360 and strategic dashboards which gives leadership a connected view of technology, operations, and outcomes.

Benefits for School Districts

When technology runs smoothly, teaching and learning thrive. Hexalytics ITSM enables districts to manage technology with greater efficiency, transparency, and confidence.

  • Improved Response Times
    Automate routine requests so IT teams can focus on high-priority issues that drive the most impact.
  • Smarter Resource Management
    Balance workloads, monitor technician performance, and allocate resources more effectively across campuses.
  • Transparency and Accountability
    Track every request and resolution in real time, creating visibility and trust across departments.
  • Reduced Downtime
    Use AI-driven insights to detect recurring issues early and keep classrooms connected without interruptions.
  • Connected Ecosystem
    Integrates seamlessly with Hexalytics’ Asset Fusion and Strategic Dashboards, offering unified visibility into IT operations and outcomes.
  • Data-Driven Decisions
    Turn IT metrics into actionable insights to guide planning, forecasting, and continuous service improvement.

Ready to simplify IT across your district?

Explore how smart, AI-powered service management can transform your support operations – one ticket at a time.

Discover how effortless IT can be.

How Dashboards Simplify Back-to-School Readiness for K-12 Districts

As the 2025–26 school year begins, district teams across the country are shifting from summer preparation to daily execution.
The first few weeks often reveal how well systems, staff, and resources were aligned. What once lived in pre-opening checklists now becomes part of an ongoing rhythm of monitoring, improvement, and support.

Yet, for many districts, the challenge remains the same. Information still lives across spreadsheets and disconnected systems. Updates take time to collect, and leaders often see progress only after the fact.

Strategic plan dashboards help districts close that gap. They turn planning into continuous readiness, giving leaders real-time visibility into goals, operations, and outcomes throughout the year.

Building a Smarter View of Progress

Readiness today is not about checking boxes. It is about seeing how every effort from technology maintenance to instructional planning contributes to district success.

That’s where Strategic Plan 360 takes shape.

The dashboards connect goals, key performance indicators, and results across departments, helping leaders measure progress clearly.
Whether it is academic achievement, operational performance, or digital equity, the platform gives districts a single source of truth to stay aligned all year.

  • The Strategic Plan Dashboard helps leaders connect strategic initiatives to measurable results, ensuring every school stays on track.
  • The Executive Dashboard provides senior leadership with a unified view of academics, finances, and operations.
  • The Digital Access Dashboard help ensure that every student has consistent access to digital tools and learning environments.

Together, these dashboards turn planning into a living process of reflection and improvement.

1. From Data to Daily Insight

With the school year underway, readiness becomes less about preparation and more about visibility.
District leaders need to know how each initiative is performing, where progress is accelerating, and where additional support is needed.

Strategic plan Dashboards make that possible.

They bring together real-time data on attendance, instruction, technology, and engagement, so leadership teams can focus on action instead of waiting for reports.
This visibility helps schools identify early trends and respond before issues grow.

Every goal becomes trackable, every update measurable, and every decision data is informed.

2. Strengthening Coordination Across Departments

A strong start to the year depends on alignment between departments.
While IT maintains infrastructure, HR manages staffing, finance tracks expenditures, and academic teams focus on learning outcomes.

The Executive Dashboard helps district leaders connect these efforts into one coordinated picture.
By linking goals and metrics across departments, it creates transparency and shared accountability. Leaders can see dependencies, allocate resources effectively, and ensure everyone is working toward the same priorities.

This shared visibility builds collaboration, consistency, and momentum.

3. Keeping the Digital Foundation Strong

Digital readiness does not end once students log in for the first time. It requires continuous monitoring.

The Digital Access Dashboard gives leaders the ability to see how connectivity, bandwidth, and device access evolve during the year.
It helps answer essential questions: Are all schools maintaining stable digital access? Are students and teachers equally supported across campuses?

By connecting digital participation data to academic outcomes, districts can ensure equitable access remains a living standard, not a seasonal goal.

4. Managing Resources with Clarity

Behind every great start is efficient resource management.
That is where Asset Fusion 360, powered by Hexalytics, adds another layer of intelligence.

It gives districts a real-time view of technology, instructional materials, and equipment across all schools. Leaders can see what is available, what needs repair, and what requires redistribution—ensuring resources are always aligned with learning needs.

By integrating this data into district planning dashboards, resource management becomes a measurable part of district success, not just an operational task.

5. Turning Readiness into Year-Round Progress

When readiness is visible, improvement never stops.
With tools like Strategic Plan 360, districts can continuously measure outcomes, adjust strategies, and communicate progress with clarity.

Dashboards keep every stakeholder informed, from school boards to families, strengthening trust through transparency.

They transform readiness from a seasonal initiative into an ongoing cycle of reflection, insight, and growth.

Because progress is not defined by the start of the year. It is measured in how clearly you can see it evolve.

Leading with Clarity

The districts that thrive in 2025–26 are those using data to see the full picture—academics, operations, technology, and resources in one connected view.

With Strategic Plan 360Digital AccessExecutive, and Asset Fusion, leaders can move from scattered reports to shared results.
This is how schools turn readiness into sustained progress and vision into action.

To learn how Strategic Plan 360 can help your district connect goals to measurable outcomes, schedule a conversation with one of our education analytics experts.

How School Districts Are Transforming Asset Management

Across the country, school districts manage thousands of assets every day—from Chromebooks and tablets to textbooks and lab equipment. Yet too often, those resources are scattered across spreadsheets, systems, and storerooms, making it nearly impossible to see the full picture.

That’s where the Asset Fusion 360 comes in.

This blog explores how Asset Fusion 360 is transforming asset management for school districts—bringing every device, textbook, and resource into one clear view that simplifies tracking, strengthens accountability, and drives smarter decisions.

From Complexity to Clarity

Every district faces the same challenge: managing more with less. Assets are spread across schools, staff, and departments, often tracked manually or inconsistently. The result is wasted time, unnecessary costs, and limited accountability. Asset Fusion 360 simplifies that complexity by unifying asset management into a single, intuitive platform. Whether you’re in IT, finance, or administration, you get a clear, customized view of the data that matters most to your role.

It’s a solution built for the realities of modern education—simple to use, powerful at scale, and designed to grow with your district.

Visibility That Works for Everyone

Asset Fusion 360 makes it easier than ever to track, manage, and optimize resources across your entire district. Here’s how:

Real-Time Tracking That Keeps You in Control

No more uncertainty about where assets are or how they’re being used. With real-time tracking, district teams can see which items are assigned, which are due for return, and which are available for allocation all immediately. Every asset is accounted for, helping schools stay proactive instead of reactive.

Smart Summaries That Simplify Big Data

Not everyone needs to dig through spreadsheets. Asset Fusion’s visual summaries turn complex data into clear, actionable insight. You can instantly view total asset counts, conditions, and values across categories, so you always know the health of your inventory and the efficiency of your spending.

Role-Based Dashboards That Empower Teams

Different roles and different needs. Asset Fusion delivers tailored dashboards for IT, finance, and operations teams. Each user sees metrics aligned to their responsibilities, making collaboration seamless and decision-making faster. Whether you’re tracking device repairs or budget allocations, the right data is always at your fingertips.

Built for Schools. Designed for Simplicity.

District technology ecosystems are already complex. Asset Fusion doesn’t add to that; it simplifies it.

With clean, user-friendly design and powerful integration capabilities, it connects effortlessly with your existing systems, giving every department a shared understanding of how resources move, perform, and evolve over time.

The platform doesn’t just show data—it tells a story. A story of where every dollar is going, how every device is used, and where improvements can make the biggest impact.

Why Districts Are Choosing Asset Fusion 360

When resources are connected, efficiency follows. Asset Fusion is transforming how districts think about asset management by making it more transparent, strategic, and accountable.

Here’s what districts gain when they bring everything together:

Smarter Asset Management

From Visibility to Vision

Asset Fusion 360 does more than manage assets—it empowers districts to lead with clarity. It’s a solution that connects information, simplifies management, and enables smarter planning at every level.

Because when every resource is visible, every decision becomes stronger. It’s time to move from managing assets to mastering them.

Ready to Connect?

Let’s discuss your priorities and how we can support your organization’s goals.

Get in Touch with Our Experts