As we move into 2026, a more efficient strategy is emerging: the shift from consultant-led snapshots to internal, dashboard-driven continuity.
The Dichotomy of Modern Enrollment
One district leader aptly summarized the challenge: “The problem we are actively solving is how to fund increased spending needs in the face of flat or declining funding.”
To bridge this information gap, school districts have historically turned to one expensive solution: the enrollment consultant.
Why the Consultant Model is Failing Districts
Traditional enrollment consultants typically address three core questions:
1.Which schools are growing or shrinking?
2.Where is our capacity underutilized?
3.Should we change boundaries or consolidate programs?
While these questions are vital, the delivery of the answers is often the problem. Consultant studies are “one-and-done” engagements. If a major housing development is delayed or a new charter school opens nearby three months after the report is filed, the district must often re-contract the consultant for a “refresh”—at an additional cost.
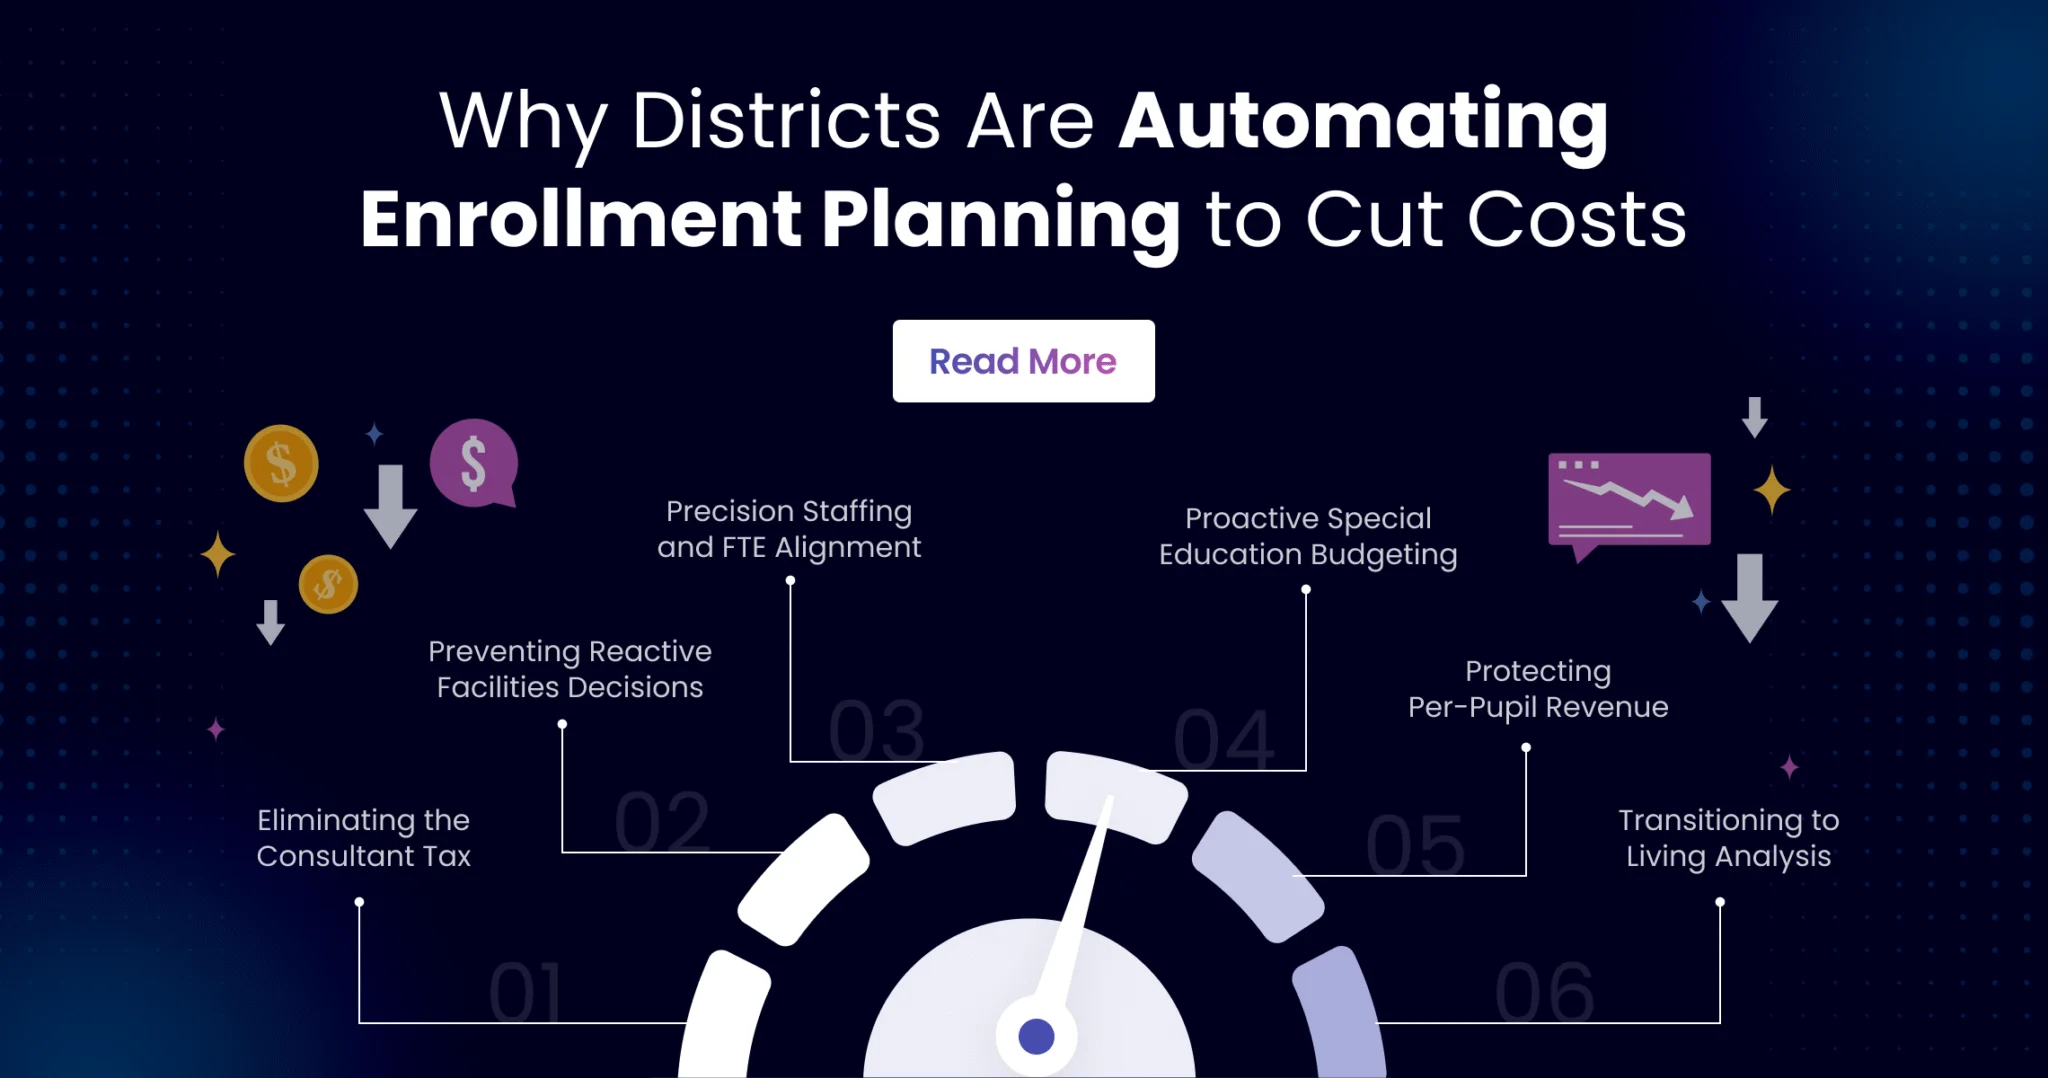
Six Ways an Enrollment Dashboard Eliminates Hidden Costs
1. Eliminating the Consultant Tax
By bringing data analysis in-house, districts can avoid recurring six-figure consulting fees. Instead of waiting months for a report, leaders have real-time visibility into trends.
- Cost Impact: Reduces repeat engagements and keeps intellectual property (data insights) within the district rather than locked in a vendor’s proprietary model.
2. Preventing Reactive Facilities Decisions
- Cost Impact: Avoids the costs of overbuilding or maintaining underutilized, “phantom” facilities.
3. Precision Staffing and FTE Alignment
Staffing accounts for roughly 80-85% of most district budgets. The dashboard surfaces enrollment declines before staffing contracts are locked in for the following year.
- Cost Impact: Reduces overstaffing by identifying grade-level shifts early, allowing for natural attrition rather than painful mid-year layoffs.
4. Proactive Special Education Budgeting
Special education enrollment often follows different trends than the general population but carries much higher per-pupil costs.
- Cost Impact: By tracking these specific trends alongside general enrollment, Strategicplan360 helps districts adjust budgets for specialized staff and services before a fiscal “surprise” occurs.
5. Protecting Per-Pupil Revenue through Intervention
When a dashboard shows exactly where students are leaving—and to which competitors—districts can intervene. Whether it’s a specific program that needs revitalizing or a school boundary that needs adjustment, earlier intervention stabilizes the “revenue leakage.”
- Cost Impact: Every student retained represents a preserved unit of state funding.
6. Transitioning to Living Analysis
In the current era of “AI-driven ERP and SIS systems,” as noted by iTech India, administrative efficiency is no longer optional. A dashboard provides a central source of truth for the Board, the Superintendent, and the Community.
- Cost Impact: Lower Total Cost of Ownership (TCO) compared to maintaining fragmented spreadsheets and paying for manual report generation.
The Bottom Line: Resilience through Efficiency
Digital Advertising Services: Strategicplan360 delivers AI-powered enrollment marketing that helps districts connect with the right families at the right moment. By feeding dashboard insights into our predictive analytics and intelligent targeting systems, we continuously refine digital campaigns to improve reach and engagement.
About StrategicPlan360
Clarity for Enrollment-Driven Leadership.
StrategicPlan360 is an AI-powered analytics platform built for K–12 district leaders navigating enrollment change. Powered by Strategicplan360, it connects real-time enrollment insights with strategic goals, resource planning, and progress monitoring in one unified view.
With over a decade of experience supporting education agencies, the platform helps districts move from static plans to continuous, data-informed decision-making. Integrated dashboards align enrollment trends with staffing, budgeting, and program priorities, giving superintendents, leadership teams, and boards the clarity they need to act with confidence.
Is your district ready to move from reactive reports to proactive strategy?
Would you like a personalized walkthrough of how our solutions can integrate your district’s specific data to forecast your next five years?
FAQs
1. Why use a dashboard instead of a consultant?
Consultants provide a “snapshot” report that is often outdated within months. Enrollment Dashboard offers a live, automated link to your data, providing continuous insights without the recurring six-figure consulting fees.
2. How does this improve staffing accuracy?
Staffing is your largest expense. By surfacing enrollment trends months before contracts are locked, you can align Full-Time Equivalent (FTE) counts with actual student demand, avoiding both overstaffing and last-minute emergency hires.
3. Can it help with Special Education (SPED) budgeting?
Yes. The dashboard tracks SPED populations separately, allowing you to forecast high-cost service needs early. This prevents mid-year budget “shocks” and ensures resources are allocated precisely where they are needed.
4. Does real-time data protect our revenue?
Absolutely. It identifies exactly where students are leaving . This “early warning” allows leadership to intervene, improve programs, and retain the per-pupil funding that supports the district.
5. Is the dashboard difficult to maintain?
No. Unlike manual spreadsheets, it integrates directly with your existing Student Information System (SIS). It replaces fragmented reporting with a “single source of truth,” reducing the administrative workload for your central office team.