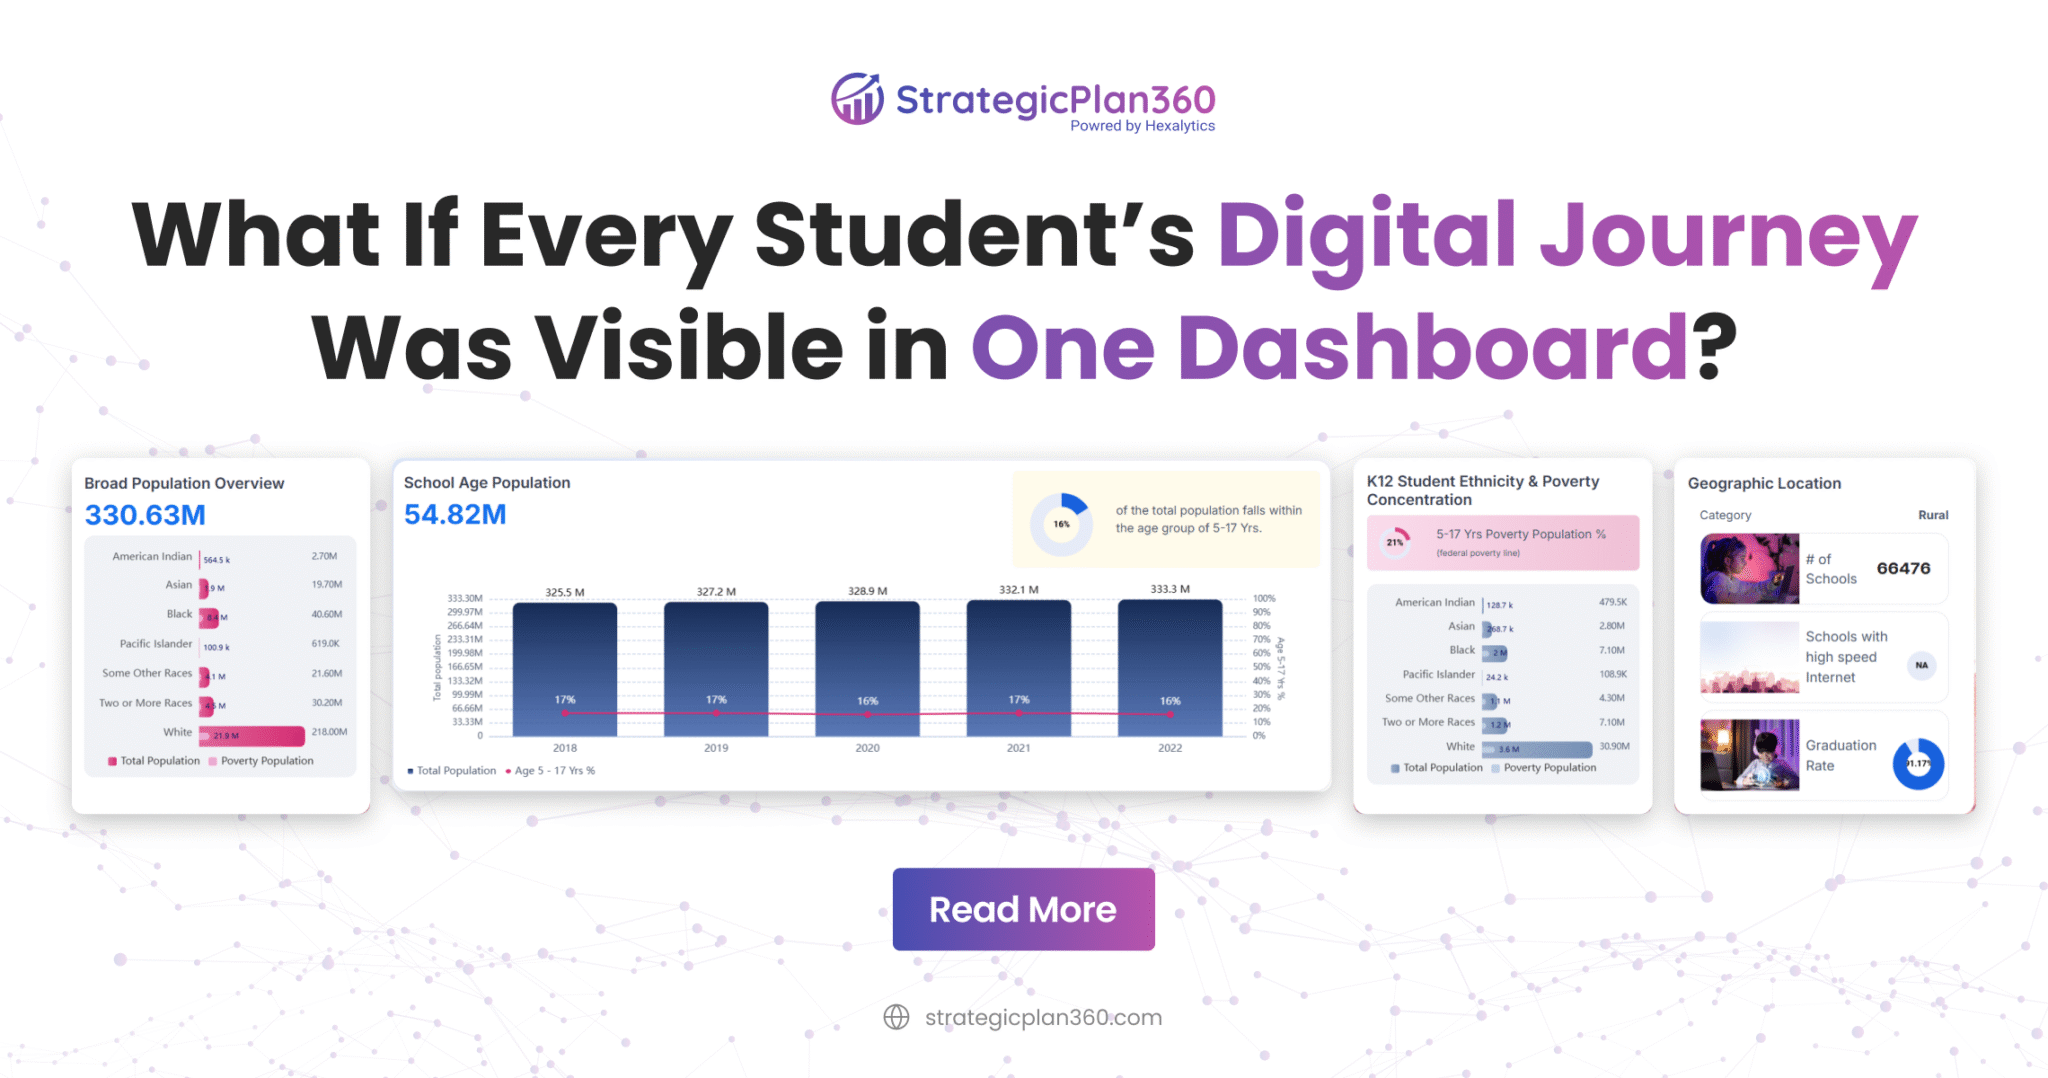
Hidden Inequities in Digital Access
Across districts today, one critical question remains unanswered: Do all students have an equal chance to connect and learn?
This blog explores how visibility into every student’s digital journey can reveal the hidden patterns behind access and equity.
From device availability to home internet quality, the challenge isn’t just collecting data—it’s seeing where the gaps truly lie. Many schools still lack a clear view of which students face connectivity issues and how they affect learning outcomes.
Why a Unified View Matters
By connecting information on devices, broadband, socioeconomic conditions, and student outcomes, it helps leaders move from assumptions to evidence. The result is a complete understanding of how digital access shapes academic success, enabling timely, fair, and data-informed decisions.
Designed for Discovery
The dashboard brings a modern, interactive design built for exploration, not just reporting.
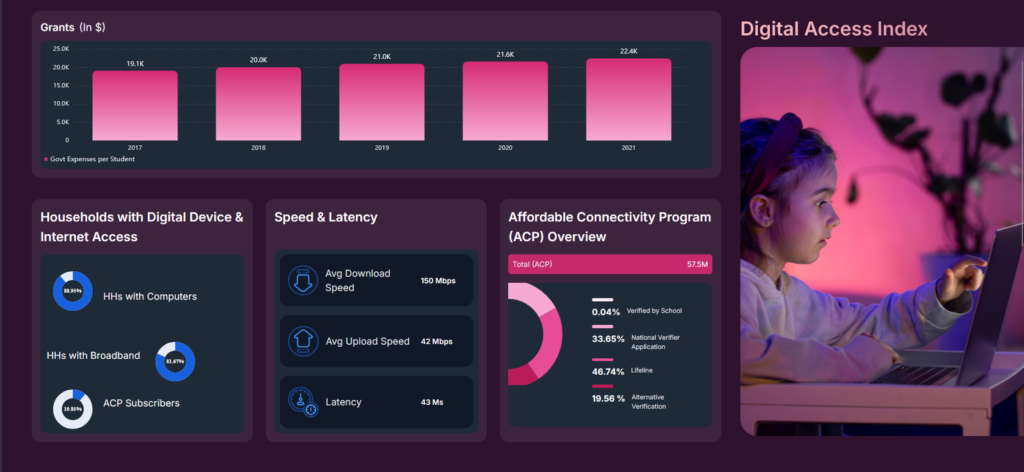
The Digital Access Index
The Digital Access Index acts as a pulse check for every district’s digital health.
It summarizes how well students, families, and schools are equipped to learn and connect.
This section showcases:
Per-student investment in technology and learning resources
Household access to computers, tablets, and broadband
Participation in the Affordable Connectivity Program (ACP)
Network quality metrics including upload and download speeds, and latency
The index brings these indicators together to help leaders understand overall readiness. When viewed over time, this index becomes a dynamic tool for tracking progress and planning investments that close the gap
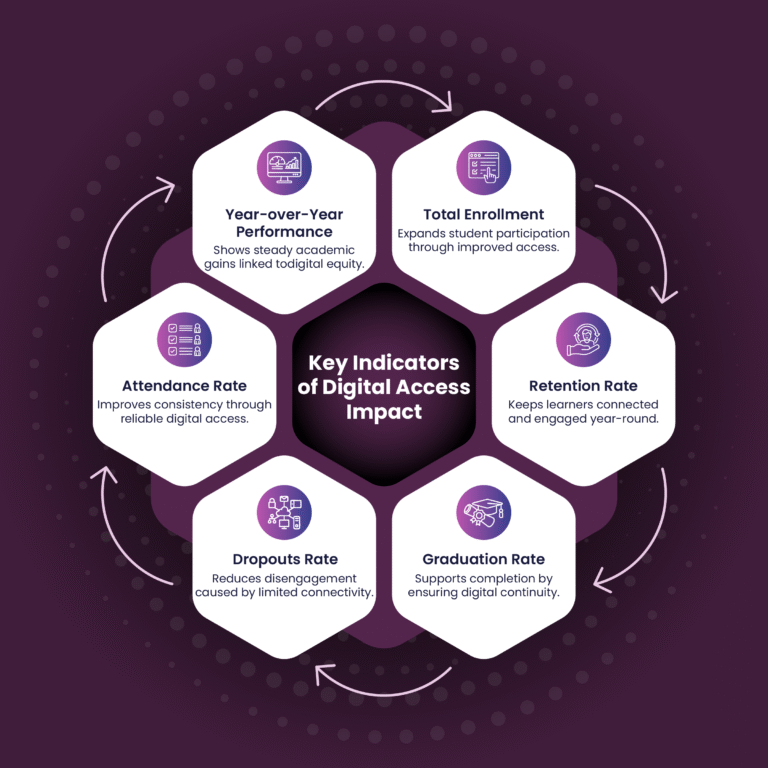
The Digital Access Impact: Connecting Access to Outcomes
Data means little unless it connects to results.
That is why the Digital Access Impact section focuses on educational outcomes linked to digital equity.
It tracks key indicators such as:
- Enrollment and retention trends
- Graduation and dropout rates
- Year-over-year improvement in performance
These insights reveal how digital readiness shapes academic success.
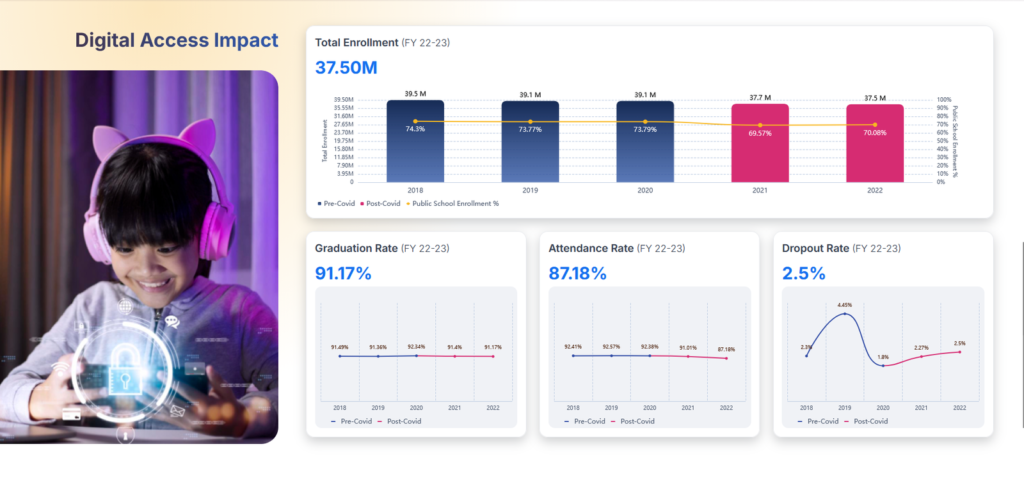
Districts can identify early warning signs — declining engagement, rising absenteeism, or slow progress and respond before issues deepen.
By connecting access with achievement, the dashboard helps leaders see where equitable investment leads to measurable learning gains.
Geospatial Map Analytics
Interactive maps reveal where digital gaps appear across schools, neighborhoods, or communities.
With color-coded metrics and historical comparisons, leaders can easily track trends and benchmark progress against county, state, or national averages.
Access and Outcomes
This powerful section connects digital access directly with student performance indicators such as enrollment, graduation, dropout, attendance, and course results.
Users can filter by school level, grade, gender, or income to uncover meaningful patterns that guide policy and intervention.
A Global Perspective on Access and Inclusion
This vision connects with global movements to ensure that technology opens doors for every learner.
For instance, UNESCO continues to advance digital inclusion in remote and underserved communities through innovative technology initiatives.
Its mission is to make education accessible everywhere—mirrors the purpose of the Digital Access Dashboard: using data to remove barriers and create opportunities for all.
The Future of Digital Equity
By making every student’s digital journey visible, this platform turns data into a force for fairness.
Districts that use these insights are not just closing digital gaps—they are creating a foundation for lasting educational equity.
Because when every student is seen, every student has a chance to succeed.
Ready to uncover your district’s digital story? Explore how the Digital Access Dashboard helps every district create pathways where every learner can thrive.
FAQs
What is a student digital journey dashboard?
It is a unified visual platform that tracks a student’s engagement, academic progress, and well-being in one real-time view.
How does a holistic student dashboard improve learning?
By consolidating data from various apps, it allows educators to identify learning gaps and provide personalized support instantly.
Can teachers see real-time student engagement data?
Yes, the dashboard integrates digital footprints from classroom tools to show exactly how and when students are interacting with content.
How does data visibility support student well-being?
It highlights shifts in behavior or participation, enabling early intervention for students who may be struggling emotionally or academically.
Does this dashboard simplify K-12 data management?
Yes, it eliminates the need to log into multiple systems by syncing SIS and edtech data into a single, actionable interface.